Introduction
In this post, you and I will iteratively optimize a Metal matrix-multiplication kernel on Apple’s M5 chip. We want to see how fast we can compute , where , , and are large matrices stored in single-precision floating-point (fp32) format using GPU. This is a special case of single-precision general matrix multiplication (SGEMM)In full SGEMM, we compute , where and are scalars. Here, we set and .. I’ll use GEMM for short when the context is clear.
The goal of this post is served as a foundational introduction to GEMM on GPU in general and Metal in particular. Although the goal is ambitious but I will try my best. This is the result of a few months of intensive work with my buddies Claude and Codex.
I am not aiming for a state-of-the-art GEMM kernel on Apple hardware but learning how the GPU behaves and why each change makes our kernel faster — or doesn’tWith the help of Codex, we can actually produce a GEMM kernel that is faster than MPS but only on a specific shape. That’s okay and honestly, agent is too good at kernel engineering.. By the end, I hope you’ll be able to analyze a kernel with the roofline model and reason about its performance: data reuse, thread ownership, and what the profiler is actually telling you.
Info
Everything in this blog is done on my MacBook Pro with an Apple M5 (10-core GPU, 24 GB of memory)If you don’t have M5, don’t worry, the FLOPs will be smaller but we can still do the same progression to get fast kernel, the only thing we cannot do on older M-chip is the Neural Accelerator (Neural Core) part., macOS 26.7, Xcode 27.0, and MLX 0.32.1, plugged into power. Every kernel computes the same row-majorRow-major is how we store matrices in memory.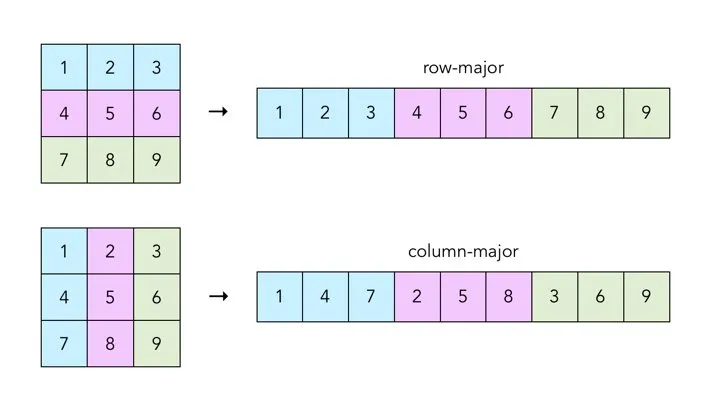 Figure from: The Craft of Coding. and non-transposed matrices with .
Here is where we’re going. Every kernel in both parts of this worklog fits on one chart:
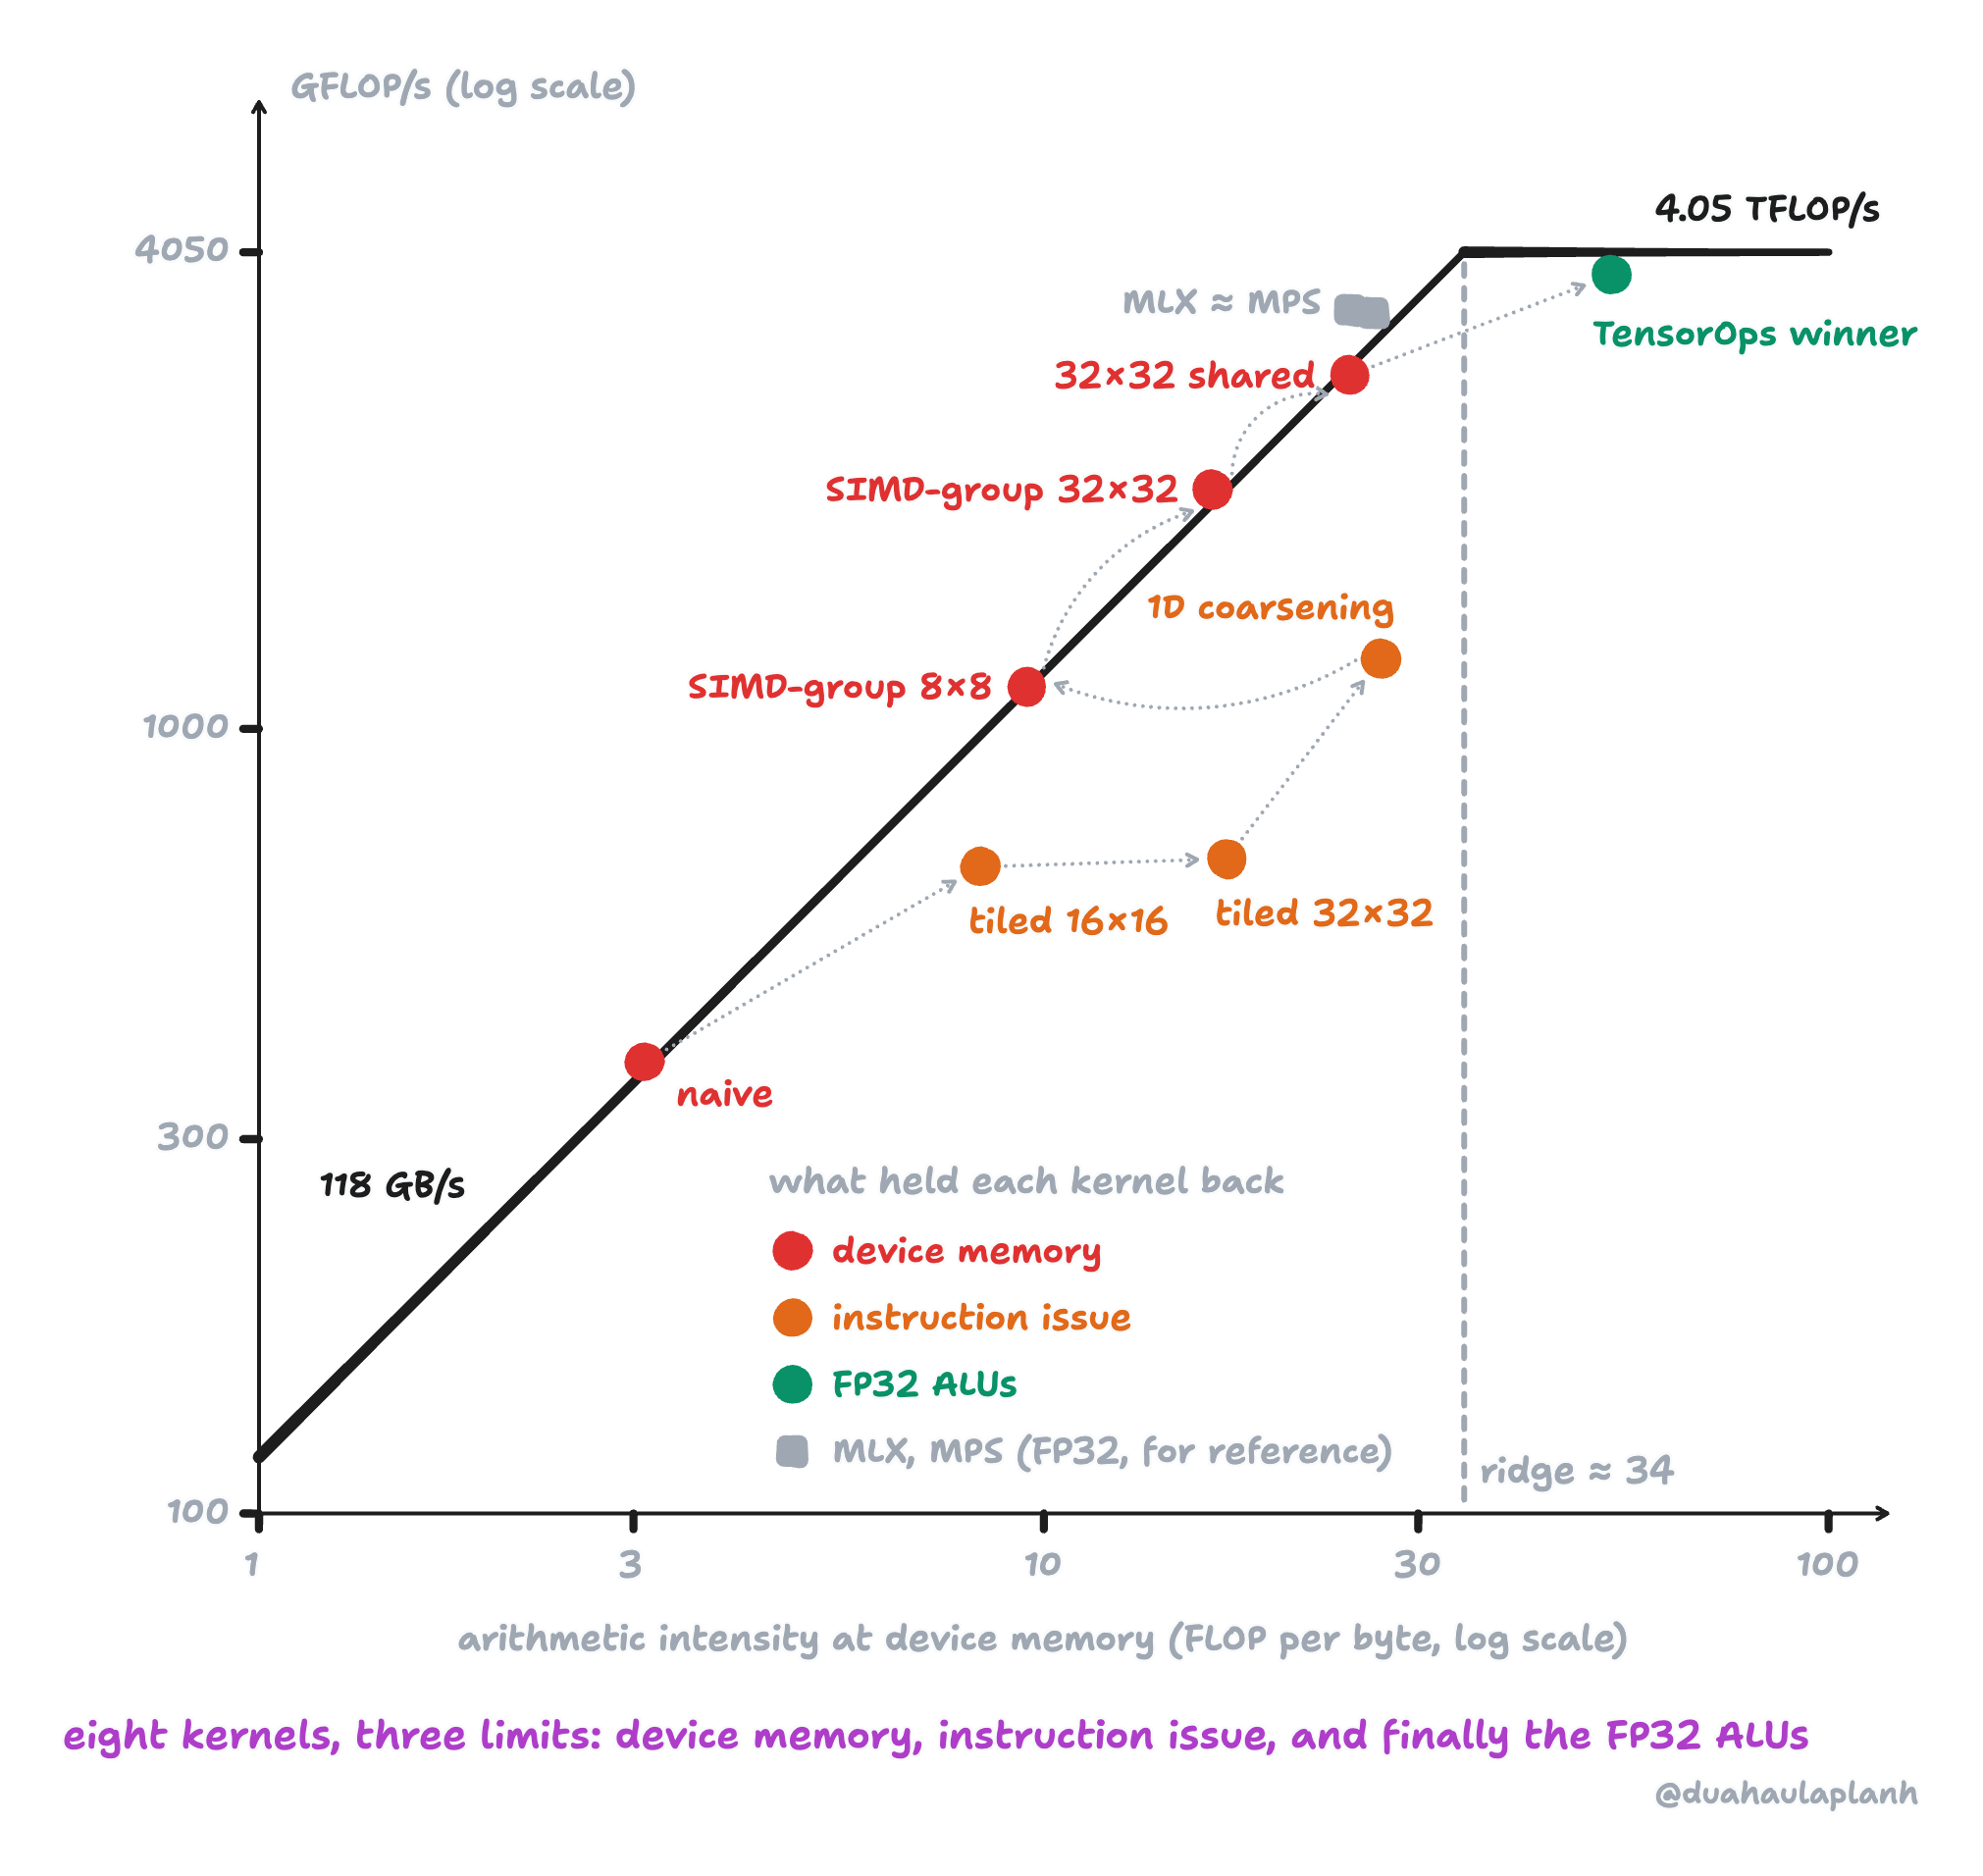
The whole worklog on one roofline. Higher is faster; further right means more arithmetic for every byte fetched from device memory. The two black lines are the M5’s ceilings: memory bandwidth (slanted) and FP32 compute (flat). The colours show what the GPU profiler said held each kernel back, and the grey squares are Apple’s own libraries. The roofline analysis under kernel 1 explains how to read this chart properly.
We start at the bottom left, with a naive kernel starved by memory, and finish at the top right in Part 2, about ten times faster and ahead of Metal Performance Shaders (MPS)MPS is a library that provides high-performance matrix multiplication and other linear algebra operations for Metal. We can think this as cuBLAS but for Apple’s GPU instead. Read more about it here. and MLX, on the same plain FP32 units they use.
Before we doing anything, we should ask what the hardware allows: the peak speed we can reach.
M5 GPU Architecture
Note
Apple doesn’t publish much about the M5 GPU architecture, so we have to reverse engineer it from the available information whereas NVIDIA documents its GPUs down to the SM (Apple why?).
From the official source
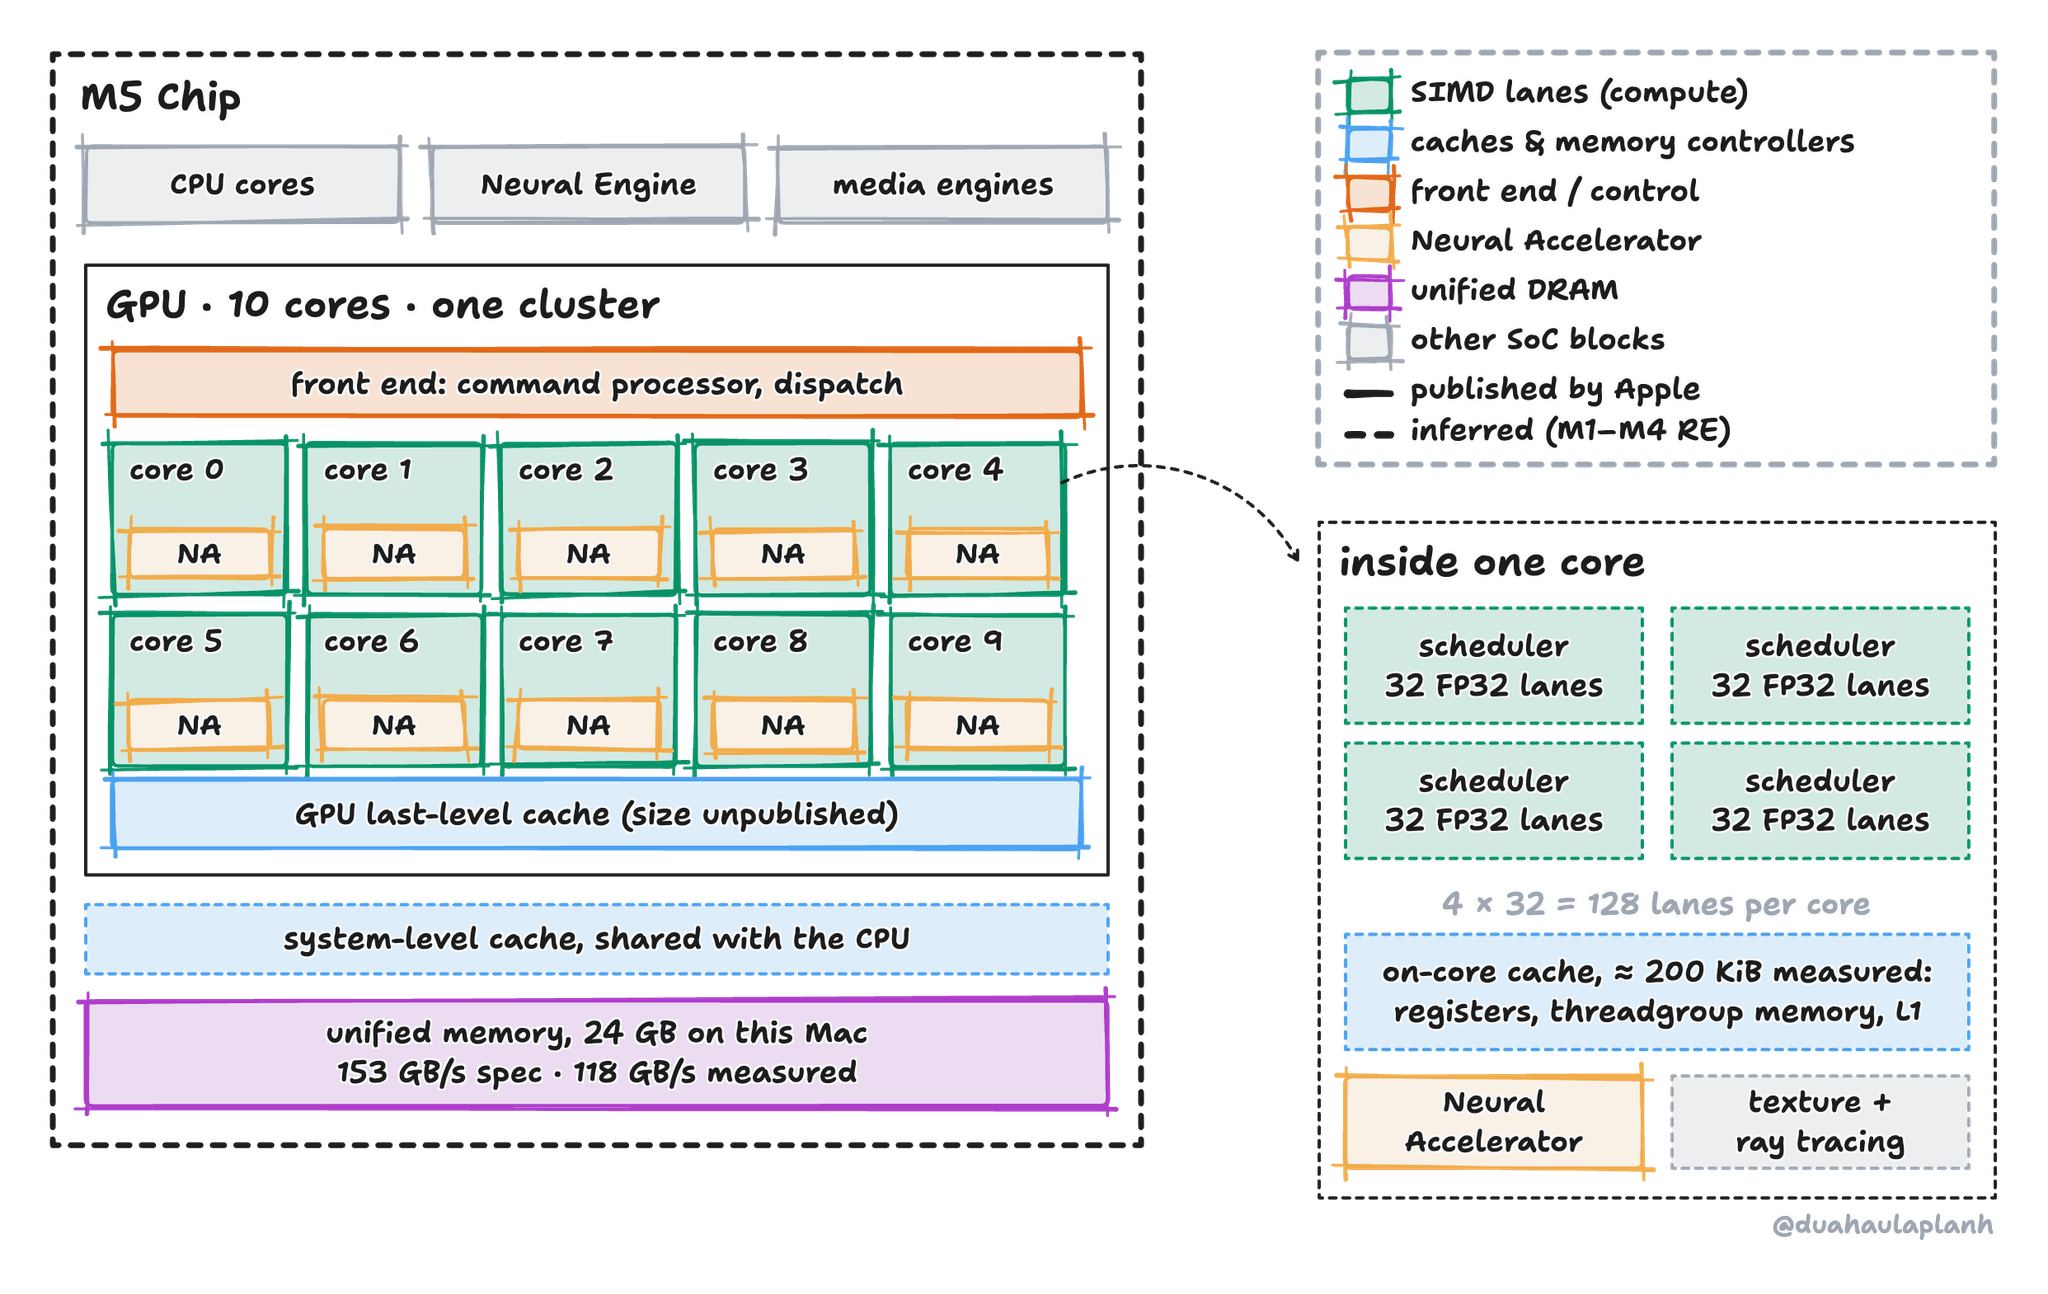
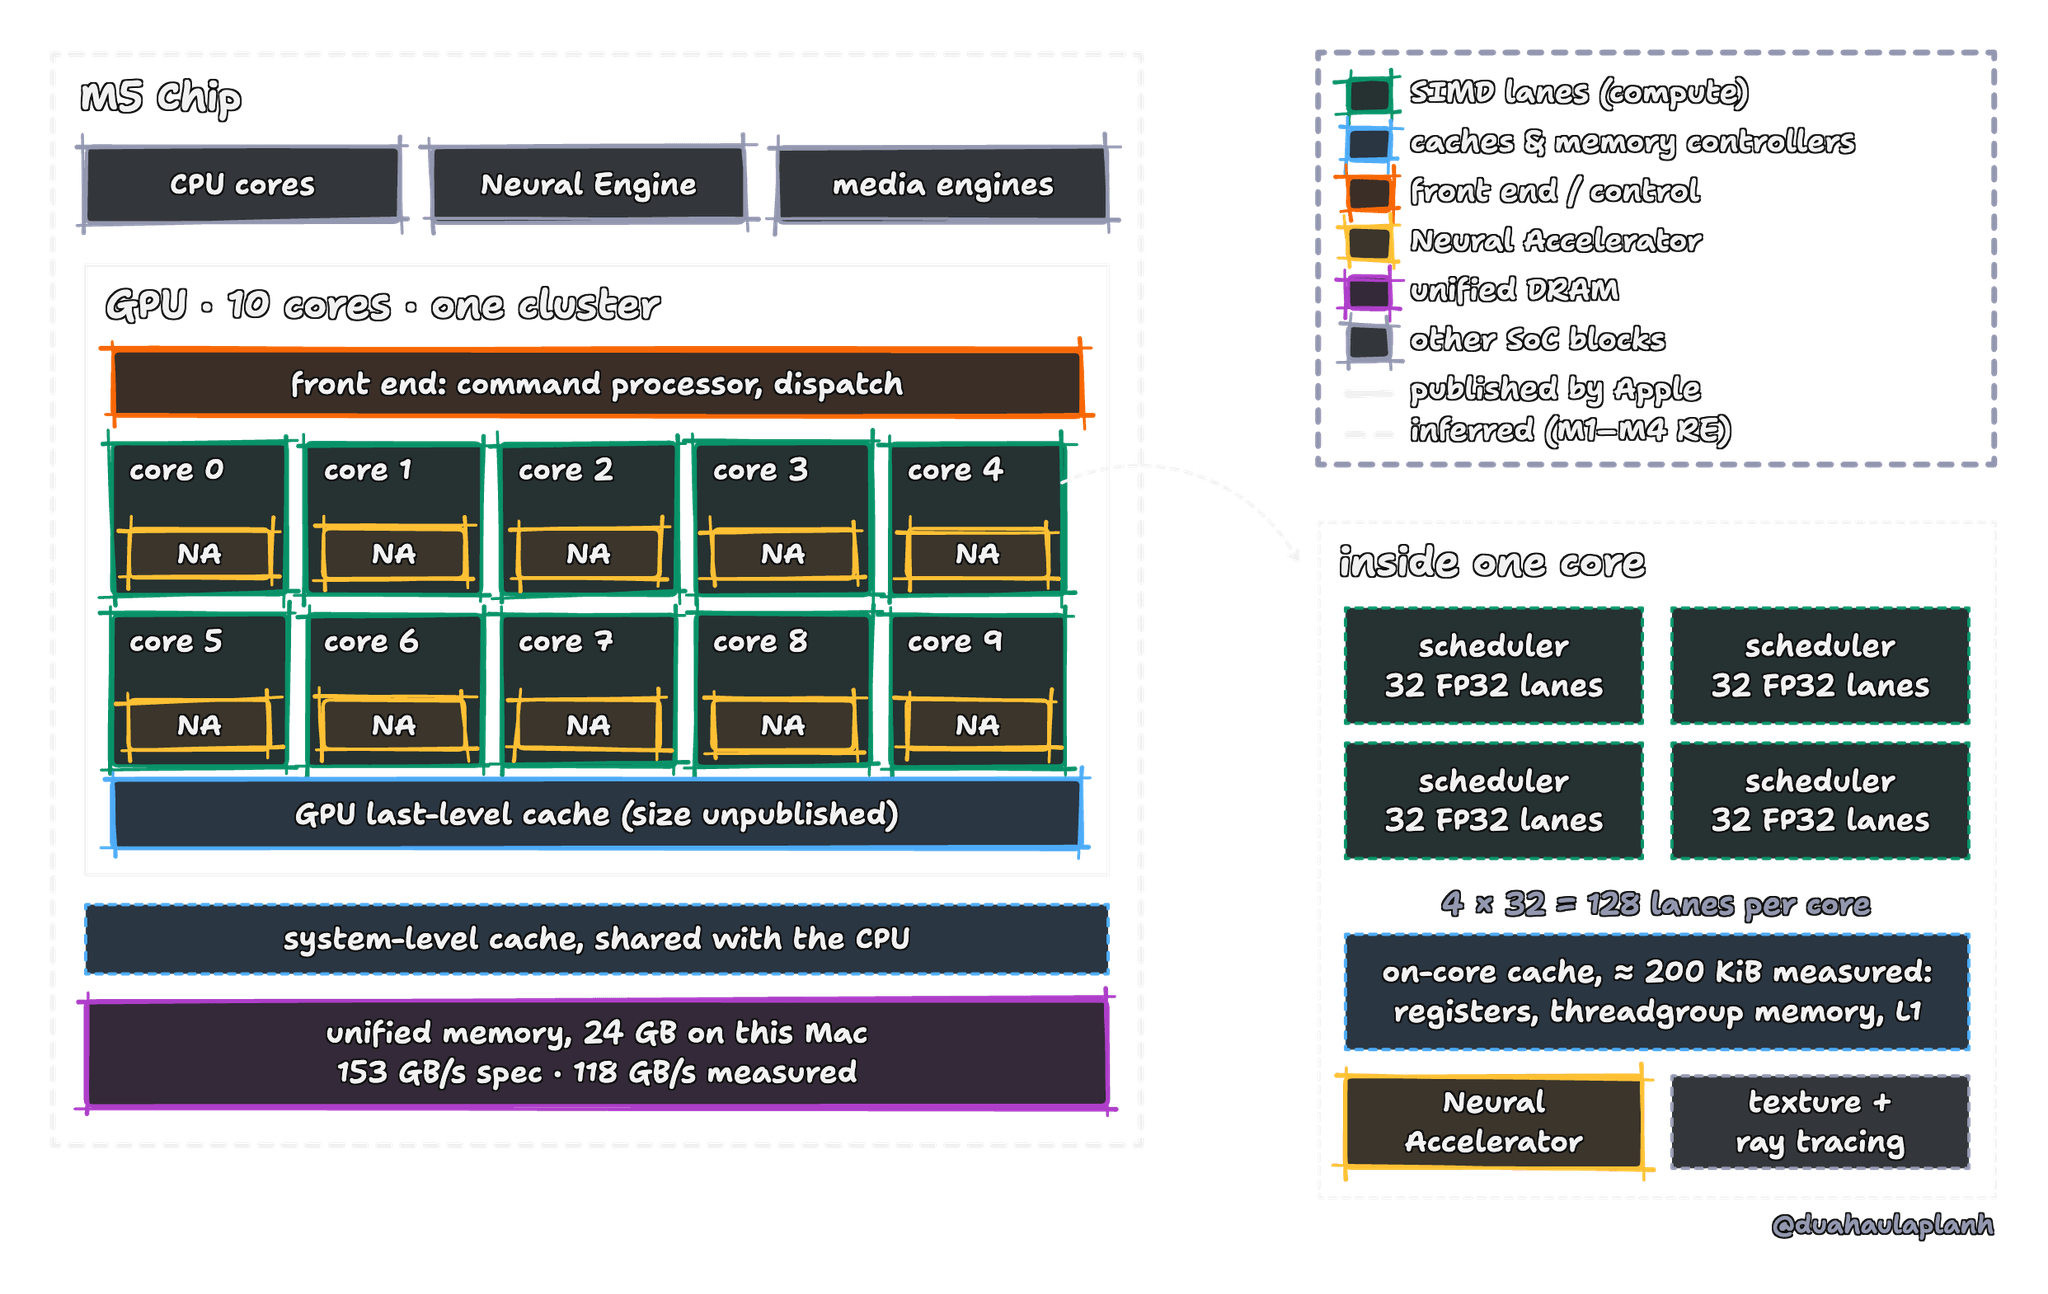
Solid outlines are published by Apple; dashed outlines are inferred from reverse engineering of M1 and M2. Apple does not publish cache sizes beyond the core, so the figure leaves them out. NA = Neural Accelerator.
The GPU is a single cluster of 10 identical cores, each core plays the role of an SM (Streaming Multiprocessor) on an NVIDIA GPU. On M1 and M2, each core has four schedulers, and each scheduler issues one instruction per cycle for a group of 32 threads
If the M5 still has 128 lanes per core as M1 and M2, then at its top two clock states, 1.578 and 1.620 GHzApple does not publish GPU clocks. These come from the GPU’s performance states in the device tree (ioreg -p IODeviceTree)., the FP32 peak would be about:
The number came from the fact that our main operation is multiply-add (FMA), which is two FLOPs. From the calculation above, the peak FLOPs of our M5 chip is between 4.04 and 4.15 TFLOP/s, and our FMA probe measures about 4.05 TFLOP/s. That is our compute ceiling for ordinary FP32 arithmetic.
For memory, Apple quotes 153 GB/s
Against this ceiling, MPS runs at 3.37 TFLOP/s, or 83%. MLX is right beside it. Below are all kernels we’ll build later:
| # | Kernel | Function in the repo | GFLOP/s | vs MPS | vs FP32 ceiling |
|---|---|---|---|---|---|
| 1 | Naive | matmul_naive | 365 | 10.8% | 9.0% |
| 2 | Tiling 16x16 | matmul_tiling_mnk16 | 650 | 19.3% | 16.1% |
| 3 | Tiling 32x32 | matmul_tiling_mnk32 | 666 | 19.8% | 16.4% |
| 4 | 1D coarsening | matmul_1D_coarsening_mn64k8 | 1222 | 36.3% | 30.2% |
| 5 | simdgroup 8x8 | simdgroup_8x8 | 1096 | 32.6% | 27.1% |
| 6 | simdgroup 32x32 | simdgroup_32x32 | 1687 | 50.1% | 41.6% |
| 7 | simdgroup 32x32, threadgroup memory | simdgroup_32x32_shared | 2722 | 80.9% | 67.2% |
| 8 | TensorOps 64x64 | tensorops_64x64 | 3035 | 90.2% | 74.9% |
| 9 | TensorOps 64x128, synchronized K | tensorops_sync_64x128_k256 | 3686 | 109.5% | 91.0% |
| MLX | 3332 | 99.0% | 82.3% | ||
| MetalPerformanceShaders (MPS) | 3365 | 100% | 83.1% |
This worklog has two parts. This part covers the hardware ceilings, the roofline model, and kernels 1 to 4: naive, shared memory tiling, and thread coarsening. Part 2 covers kernels 5 to 9: SIMD-group matrices and TensorOps. Our best kernel, which uses Neural Accelerator, reaches 91%.
Kernel 1: Naive Implementation
Let’s remember how we do matrix multiplication in undergraduate algorithm classes. To multiply two matrices, we visit each element of and take the dot product of the corresponding row of and column of . In code, that gives us three nested loops like this:
Code
for each row i of C: for each column j of C: sum = 0 for k = 0, ..., K-1: sum += A[i, k] * B[k, j] C[i, j] = sumNow look at the outer two loops: they only choose which element of to compute. Since different output elements do not depend on one another, we can compute these row-and-column pairs in parallel.
Code
for each thread (i, j) in parallel: sum = 0 for k = 0, ..., K-1: sum += A[i, k] * B[k, j] C[i, j] = sumTo achieve that in GPU programming model, we give each of those computations to a thread.
These threads are executed in parallel by the GPU and each thread has its own data, and will execute the same function so we have SPMD (Single Program Multiple Data) paradigm. Multiple threads form a threadgroup If you know CUDA, a Metal threadgroup plays the role of a CUDA block., and together multiple threadgroups cover a gridWe can map thread to matrix multiplication like this: each thread will compute one element , and its data is the row of and column of corresponding to the element it computes. Then all thread will run the same dot product function along dimension same function, different data..
Our naive kernel uses threads per threadgroup, so a output needs a grid of threadgroups:
![A 128 by 128 grid of threadgroups with threadgroup (2, 1) highlighted, zoomed into its 32 by 32 threads with thread (29, 3) highlighted, zoomed into one thread. That thread computes column j = 2 times 32 plus 29 = 93 and row i = 1 times 32 plus 3 = 35, so it owns C[35, 93].](/_vercel/image?url=_astro%2Fthread-hierarchy-light.CezurkPO.png&w=2048&q=100)
![A 128 by 128 grid of threadgroups with threadgroup (2, 1) highlighted, zoomed into its 32 by 32 threads with thread (29, 3) highlighted, zoomed into one thread. That thread computes column j = 2 times 32 plus 29 = 93 and row i = 1 times 32 plus 3 = 35, so it owns C[35, 93].](/_vercel/image?url=_astro%2Fthread-hierarchy-dark.D7MMp0vl.png&w=2048&q=100)
Grid, threadgroup, thread. Thread of threadgroup owns . Layout adapted from
Metal gives each thread its group’s position in the grid — through threadgroup_position_in_grid — and its own position within that group — through thread_position_in_threadgroup In CUDA we use <<<gridDim, blockDim>>> to dispatch a kernel and read blockIdx and threadIdx inside it. Metal’s threadgroup_position_in_grid and thread_position_in_threadgroup play the same roles.. The kernel combines them to find the output row and column it owns. Below is the naive kernel implementation in Metal:
C++
kernel void matmul_naive( device const float * A [[buffer(0)]], device const float * B [[buffer(1)]], device float * C [[buffer(2)]], uint M, uint N, uint K, uint2 block_pos [[ threadgroup_position_in_grid ]], uint2 thread_pos [[ thread_position_in_threadgroup ]], uint2 threads_per_group [[ threads_per_threadgroup ]]) { // x selects the column, y selects the row uint j = block_pos.x * threads_per_group.x + thread_pos.x; // column uint i = block_pos.y * threads_per_group.y + thread_pos.y; // row
// check if the thread is within the bounds if (i < M && j < N) { float sum = 0.f; for (uint p = 0; p < K; ++p) { sum += A[i * K + p] * B[p * N + j]; } C[i * N + j] = sum; }}Note
When we launch kernel threads, we round the group counts up, across and down, so some threads at the edges may fall outside . We check and before reading or writing. A valid thread now knows which row of and column of to multiply.
If you want to know more about how to launch a Metal kernel, you should read Apple’s compute guide in depth, I won’t cover it in this post.
Let’s follow our thread through the whole kernel. We choose thread in threadgroup as an example. It owns , so it walks along row 35 of and down column 93 of , one element of each per loop step:
![Matrices B at the top, A at the bottom left and C at the bottom right, sharing dimension K between A and B. Row i = 35 of A and column j = 93 of B are highlighted and meet at one cell of C inside threadgroup (2, 1). On the right, the thread takes the dot product of A[35, p] and B[p, 93] over 4096 steps and stores the sum back into C. At the bottom, the same loop in row-major addresses: for p from 0 to 4095, sum += A[i K + p] times B[p N + j]; then C[i N + j] = sum. Two loads and one multiply-add per step, 8192 loads per thread.](/_vercel/image?url=_astro%2Fone-thread-light.CFNKNZnc.png&w=2048&q=100)
![Matrices B at the top, A at the bottom left and C at the bottom right, sharing dimension K between A and B. Row i = 35 of A and column j = 93 of B are highlighted and meet at one cell of C inside threadgroup (2, 1). On the right, the thread takes the dot product of A[35, p] and B[p, 93] over 4096 steps and stores the sum back into C. At the bottom, the same loop in row-major addresses: for p from 0 to 4095, sum += A[i K + p] times B[p N + j]; then C[i N + j] = sum. Two loads and one multiply-add per step, 8192 loads per thread.](/_vercel/image?url=_astro%2Fone-thread-dark.P4dGc0X1.png&w=2048&q=100)
One thread of the naive kernel. Adapted from
Before we go any further, one choice in the naive kernel deserves a closer look. Go back to the first two lines of the kernel. A thread at position computes : the horizontal coordinate becomes the column , and becomes the row . But why?
- In memory, the column index varies fastest. is row-major, so lives at offset . Moving one column to the right moves 4 bytes; moving one row down jumps bytes, which is 16 KiB when .
- Among threads,
xvaries fastest. A threadgroup numbers its threads linearly as . The GPU executes them in SIMD groups of 32 threads that issue each instruction together and it packs consecutive linear indices into the same SIMD group The same concept in CUDA is called warp. In CUDA, we always have a fixed number of threads in a warp, which is 32. The figure is from[1] .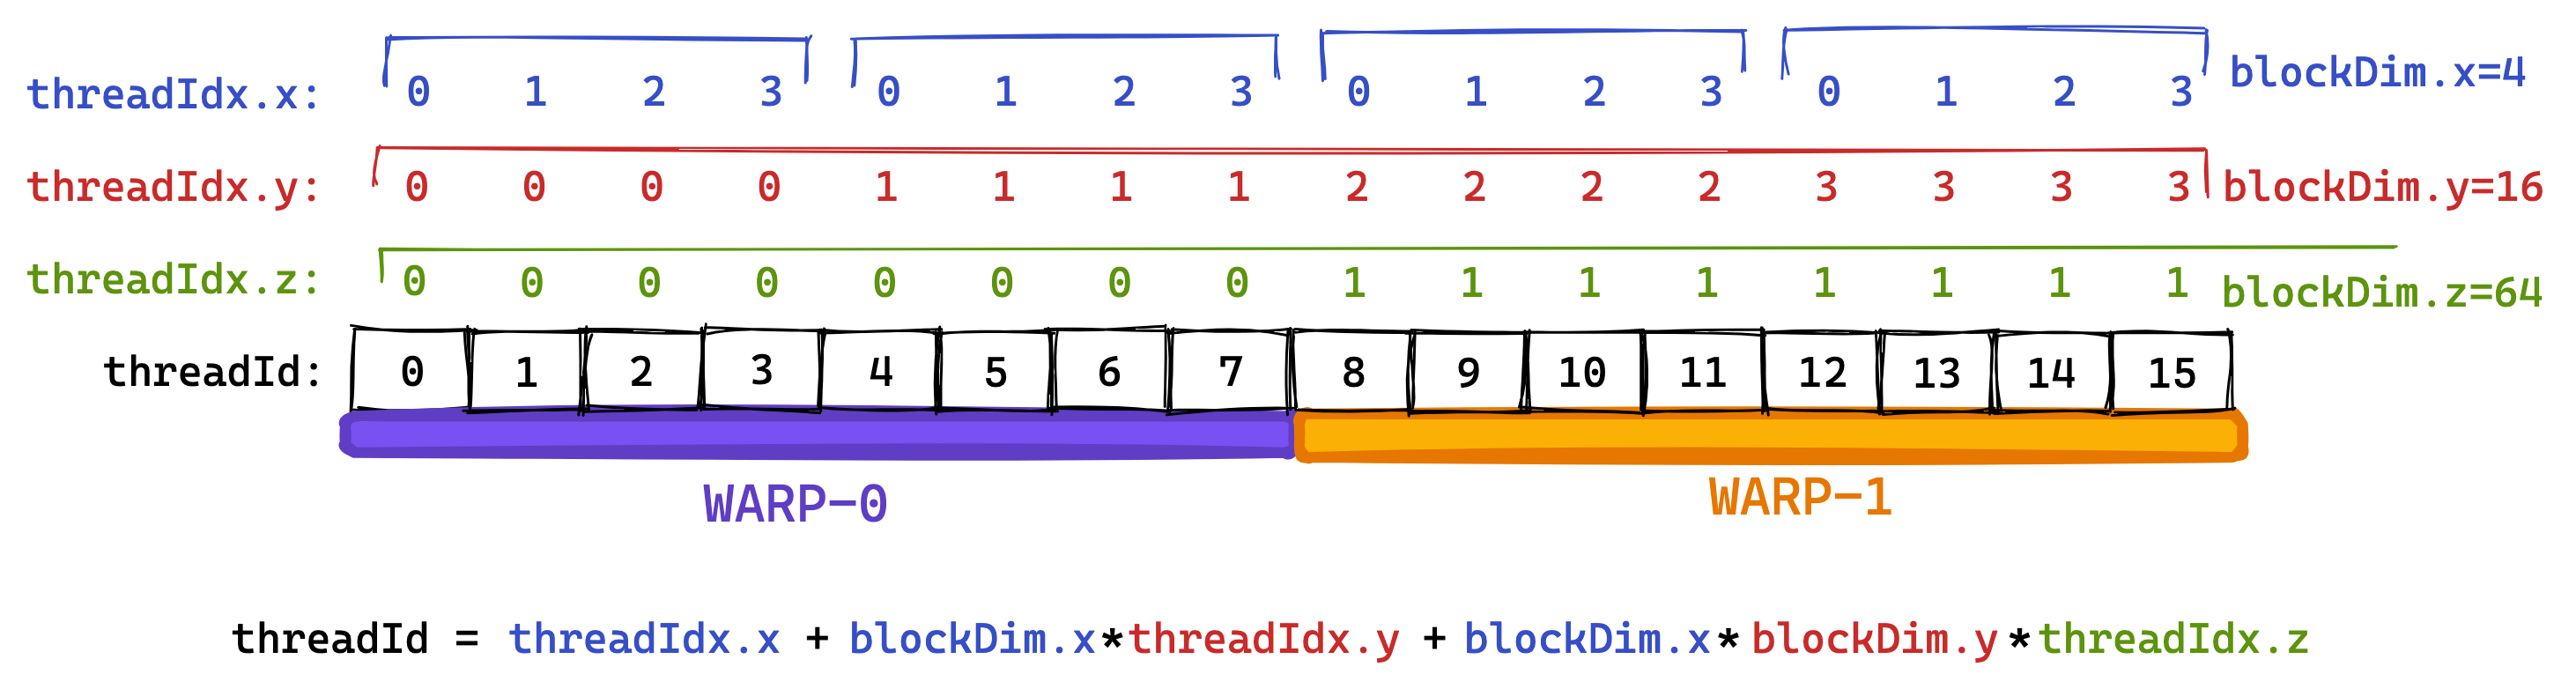 But in Apple’s GPU, we cannot assume the same. We need to use use
 threadExecutionWidthto get the actual warp size. In my M5, it is 32..
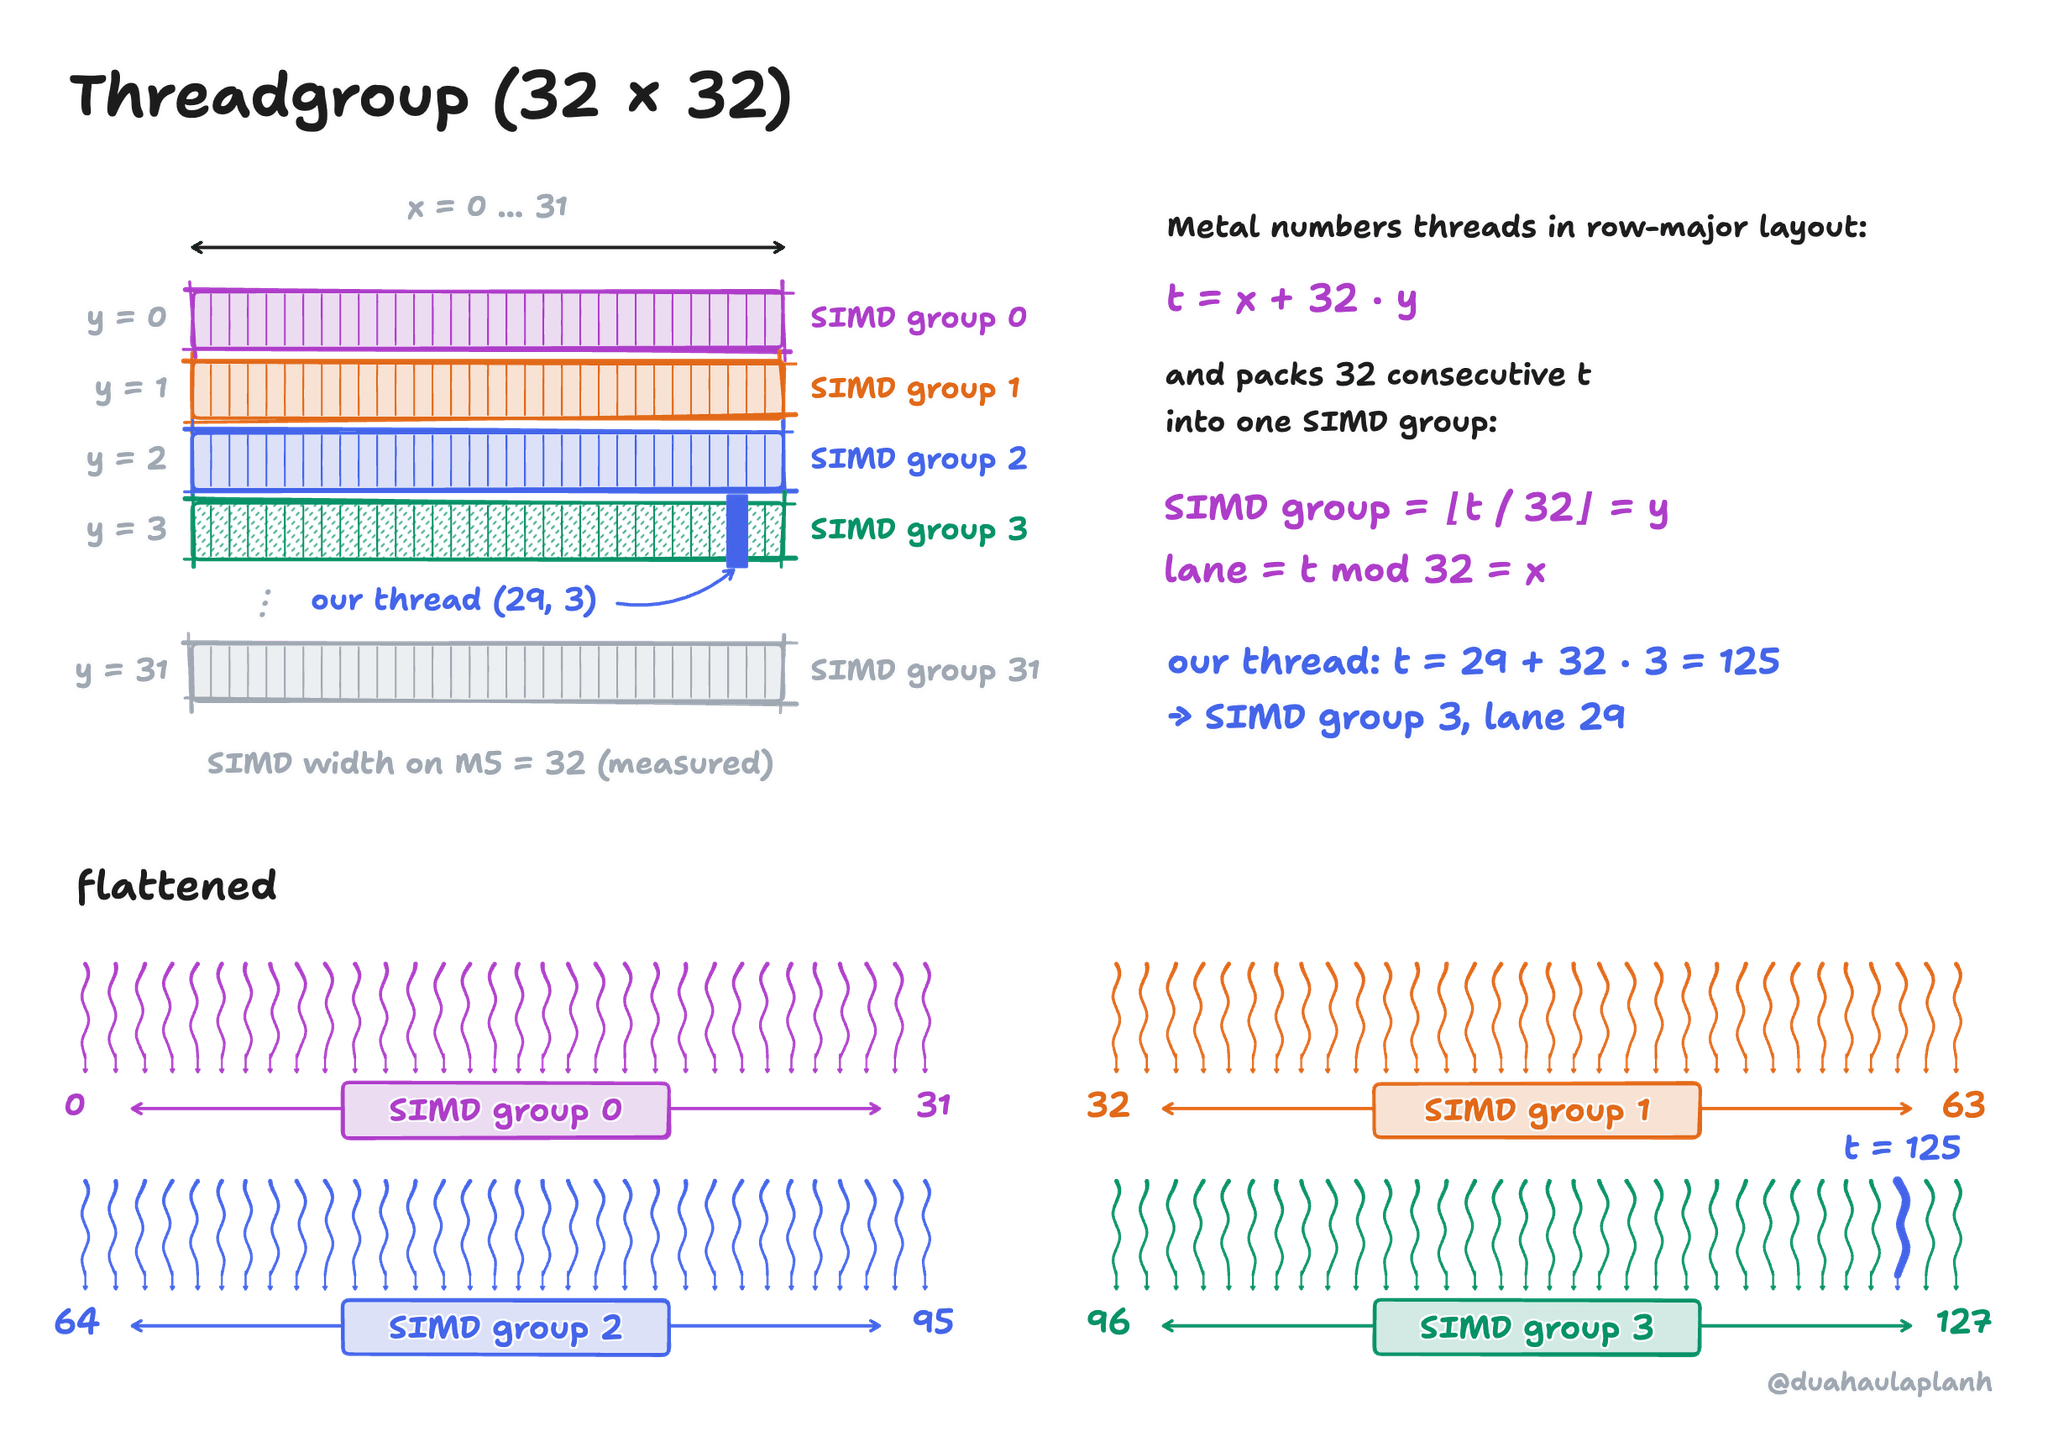
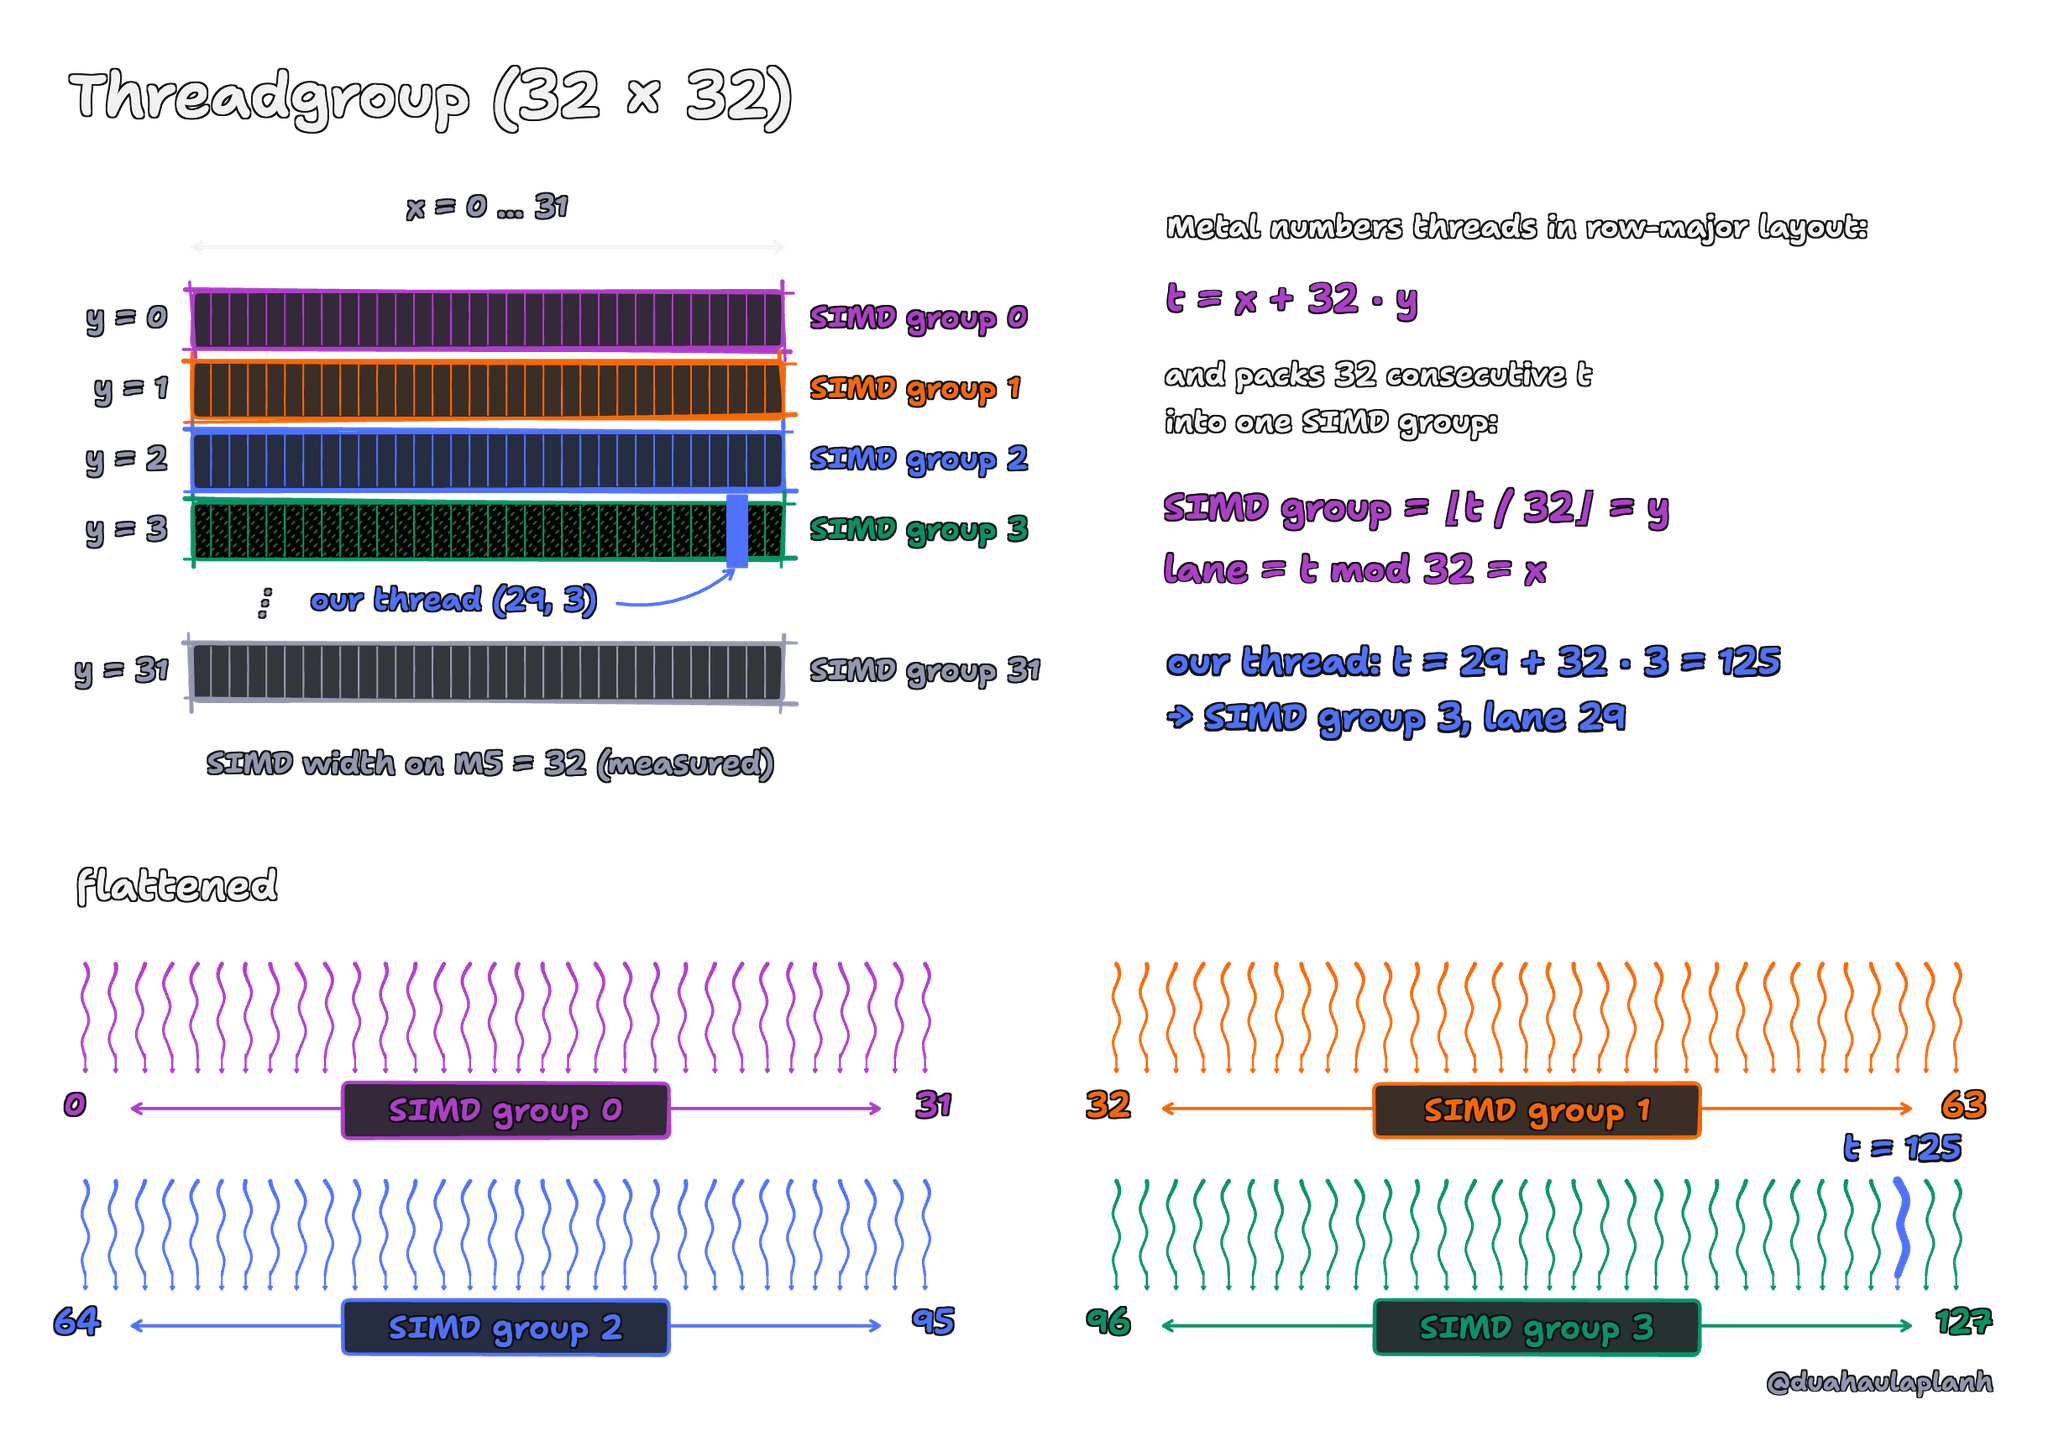
How a threadgroup packs into SIMD groups. With 32 threads per row, each SIMD group is exactly one row of the threadgroup. The figure follows
Put the two statements above together. With our mapping, the 32 lanes of a SIMD group share a row and hold consecutive columns . At step of the loop they all want the same , and they want , which are 32 neighbouring floats in one 128-byte span.
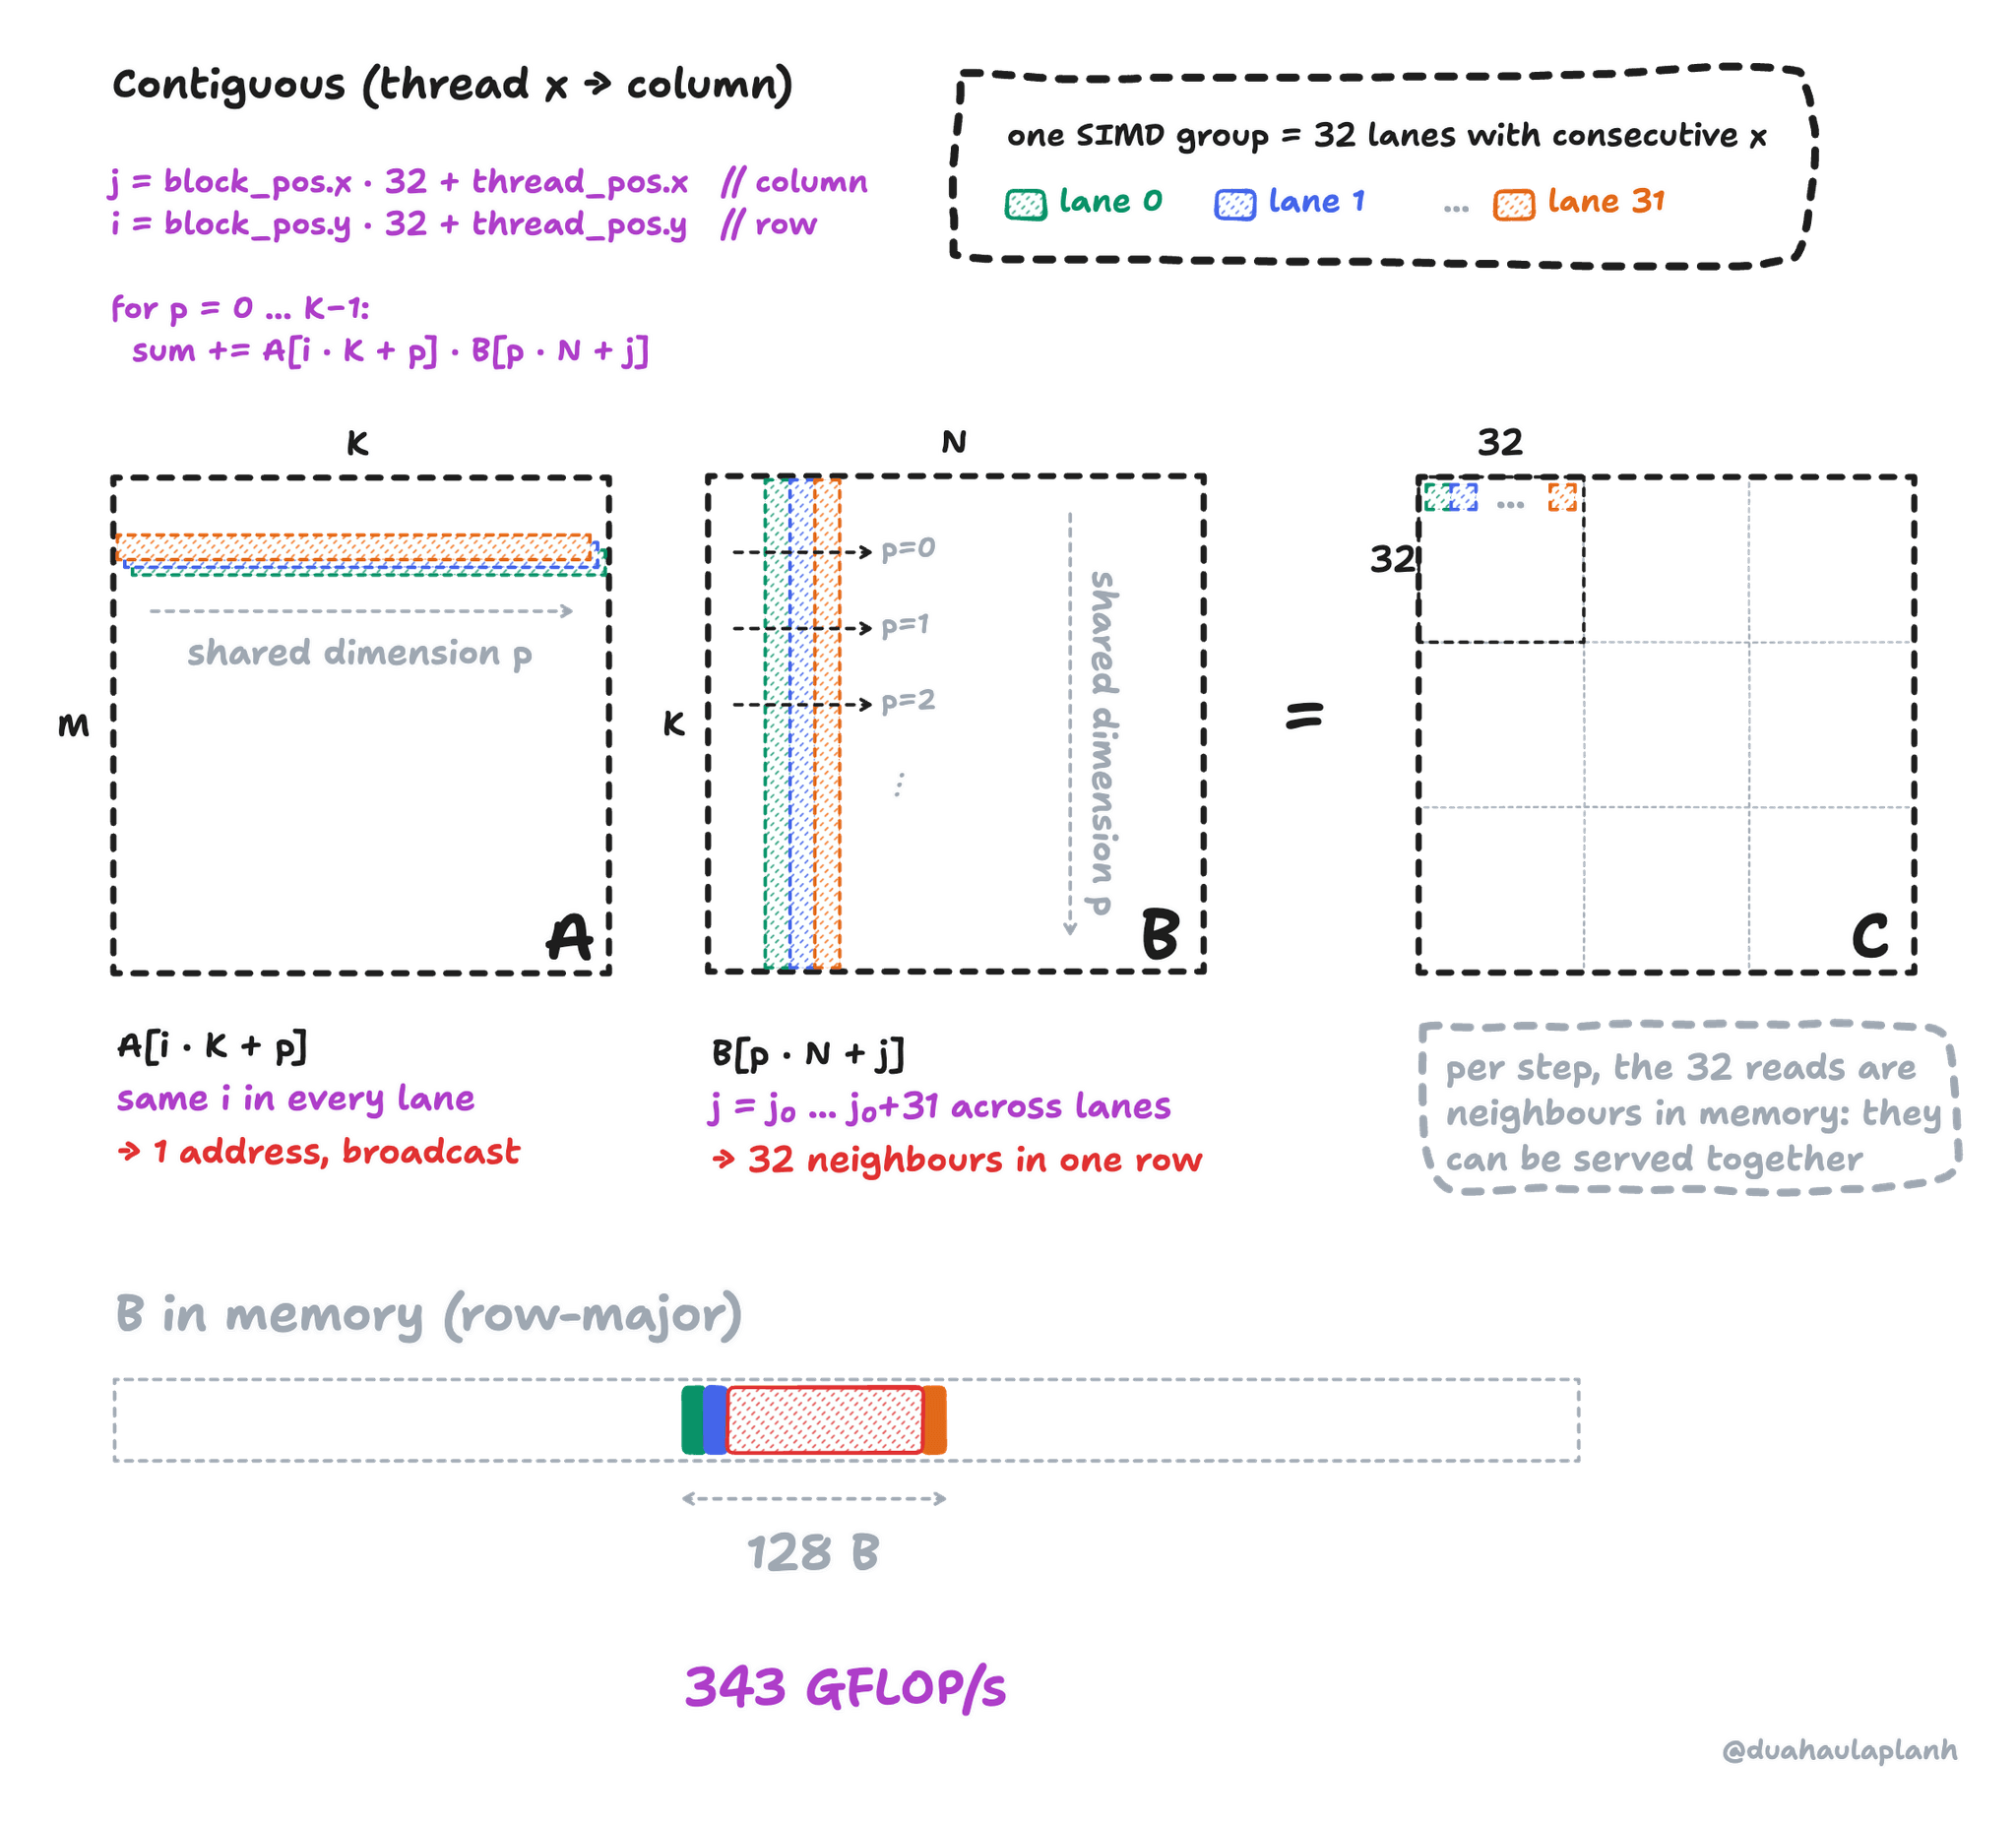
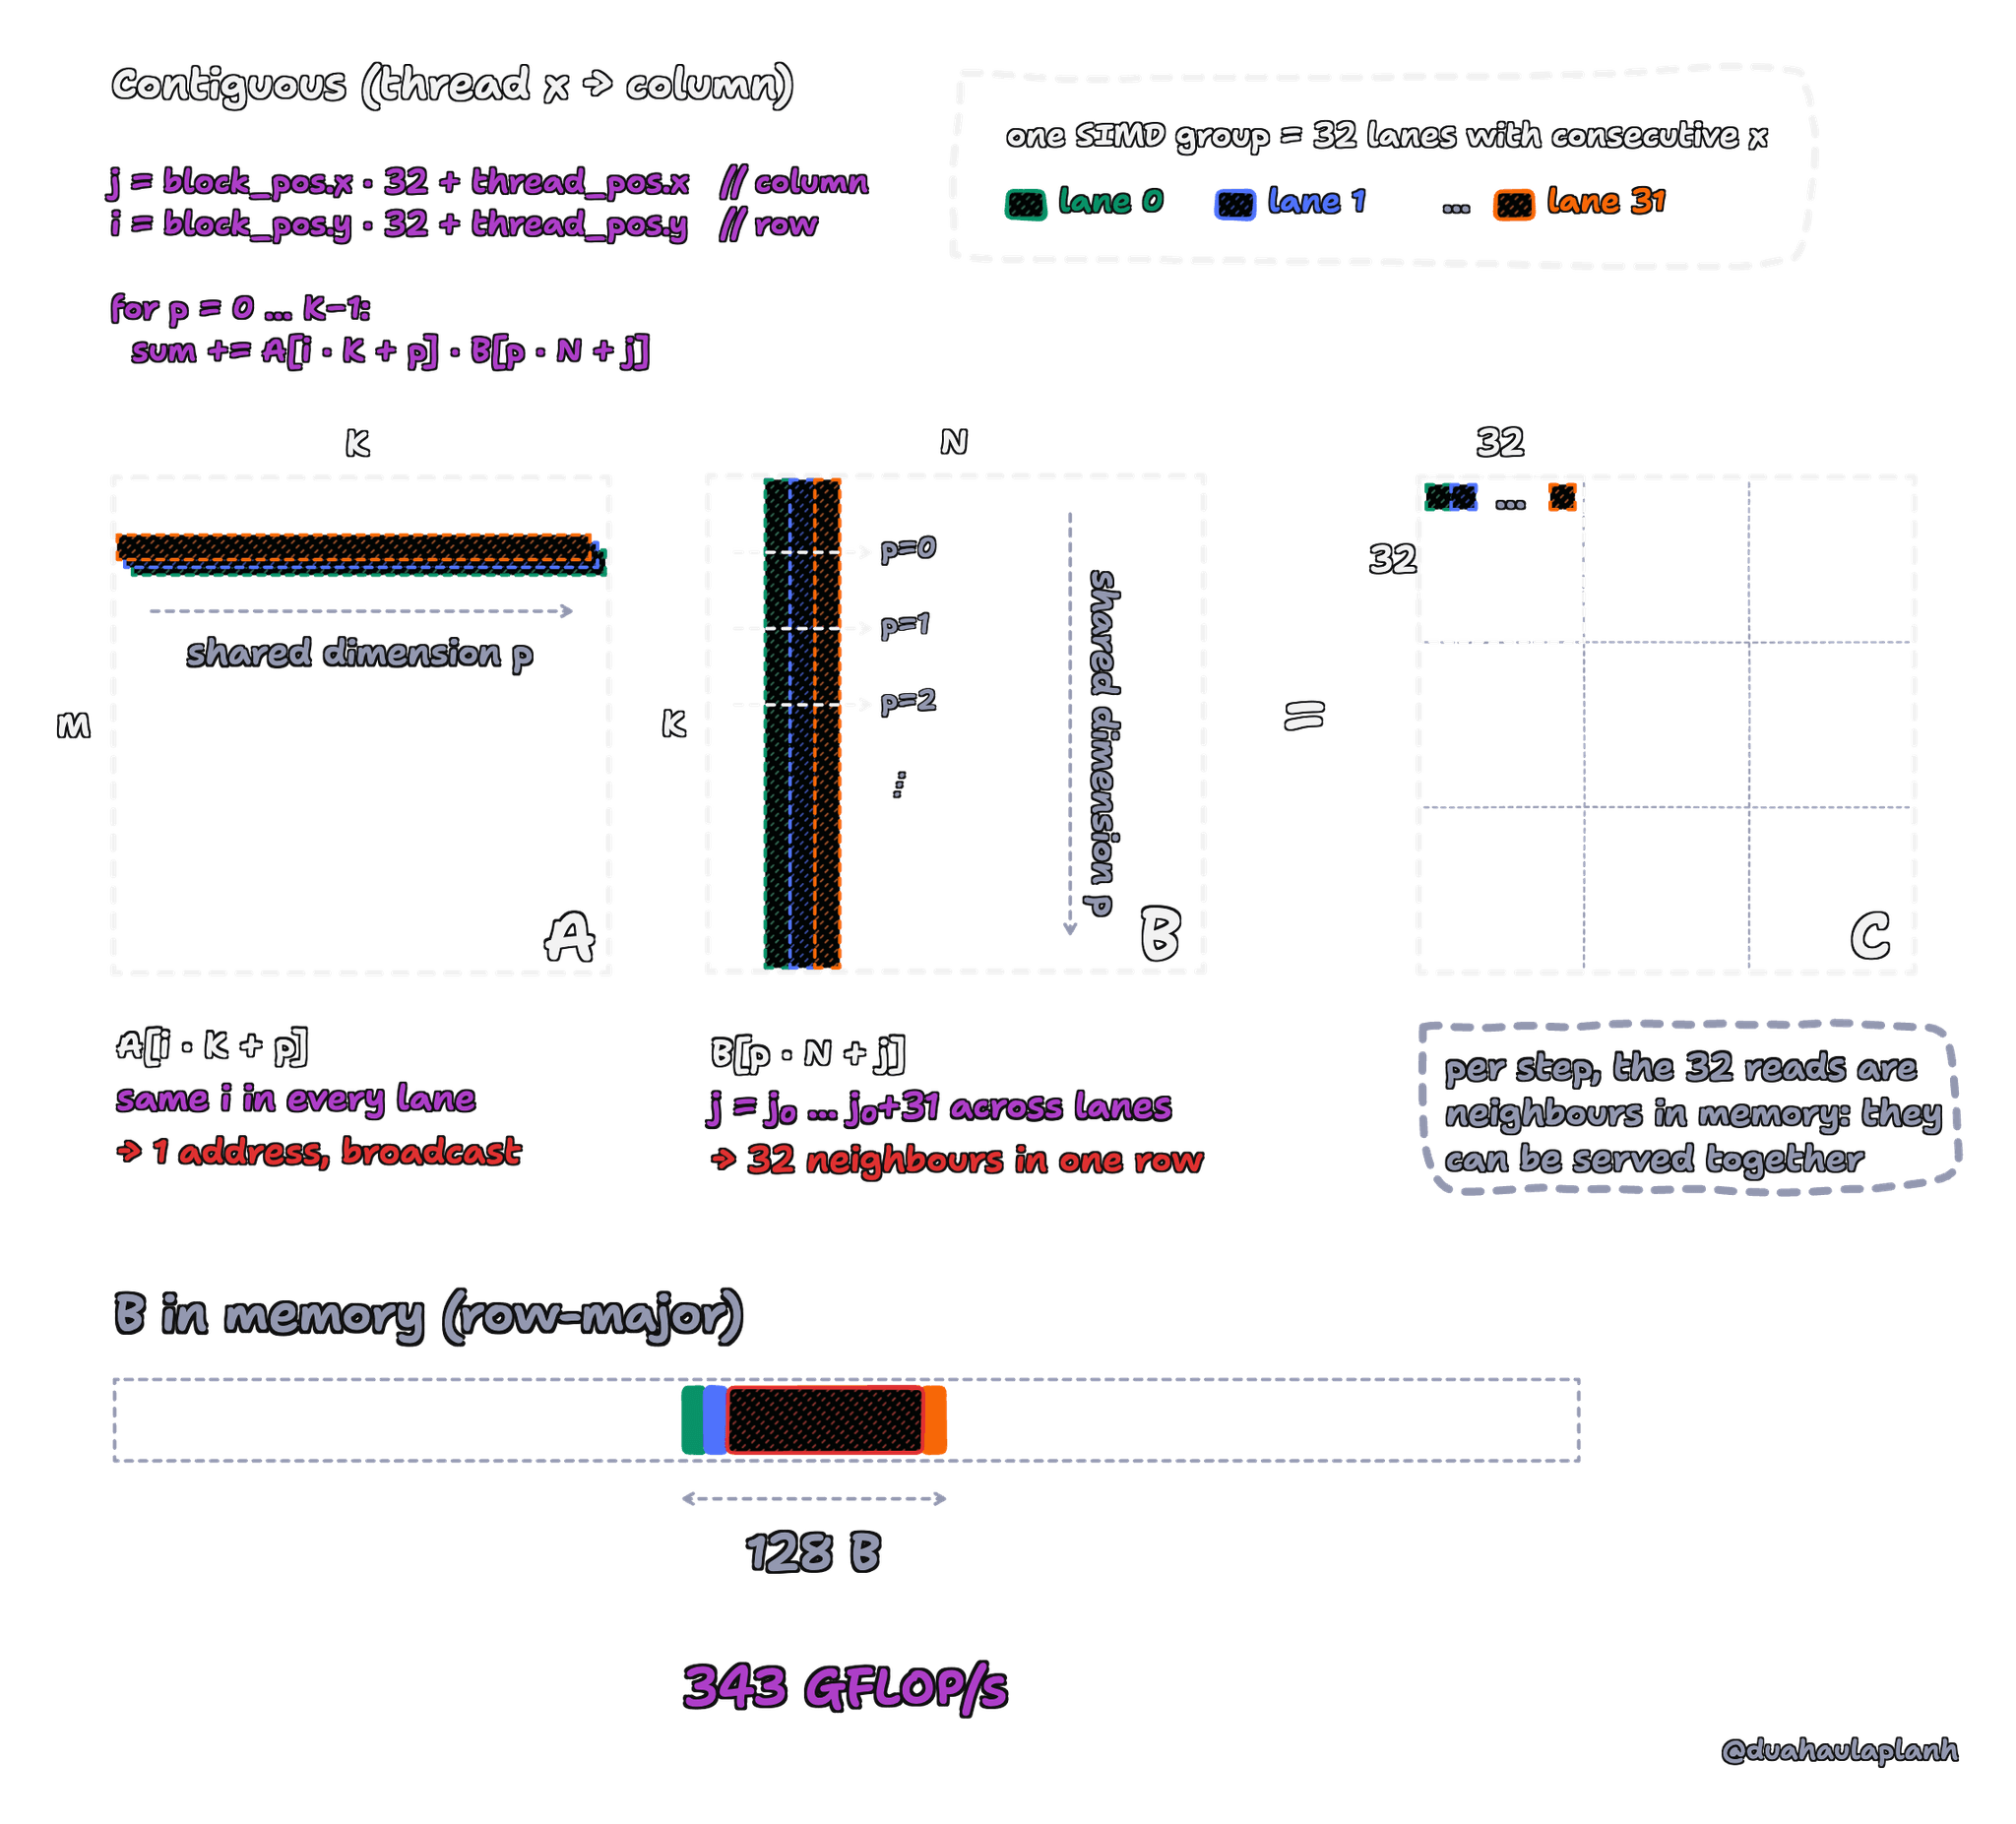
Our mapping (thread_pos.x → column): what one SIMD group reads at each step . Layout adapted from
Flip the mapping and the lanes share a column instead. Then they all want the same but 32 different rows of , each 16 KiB from the next.
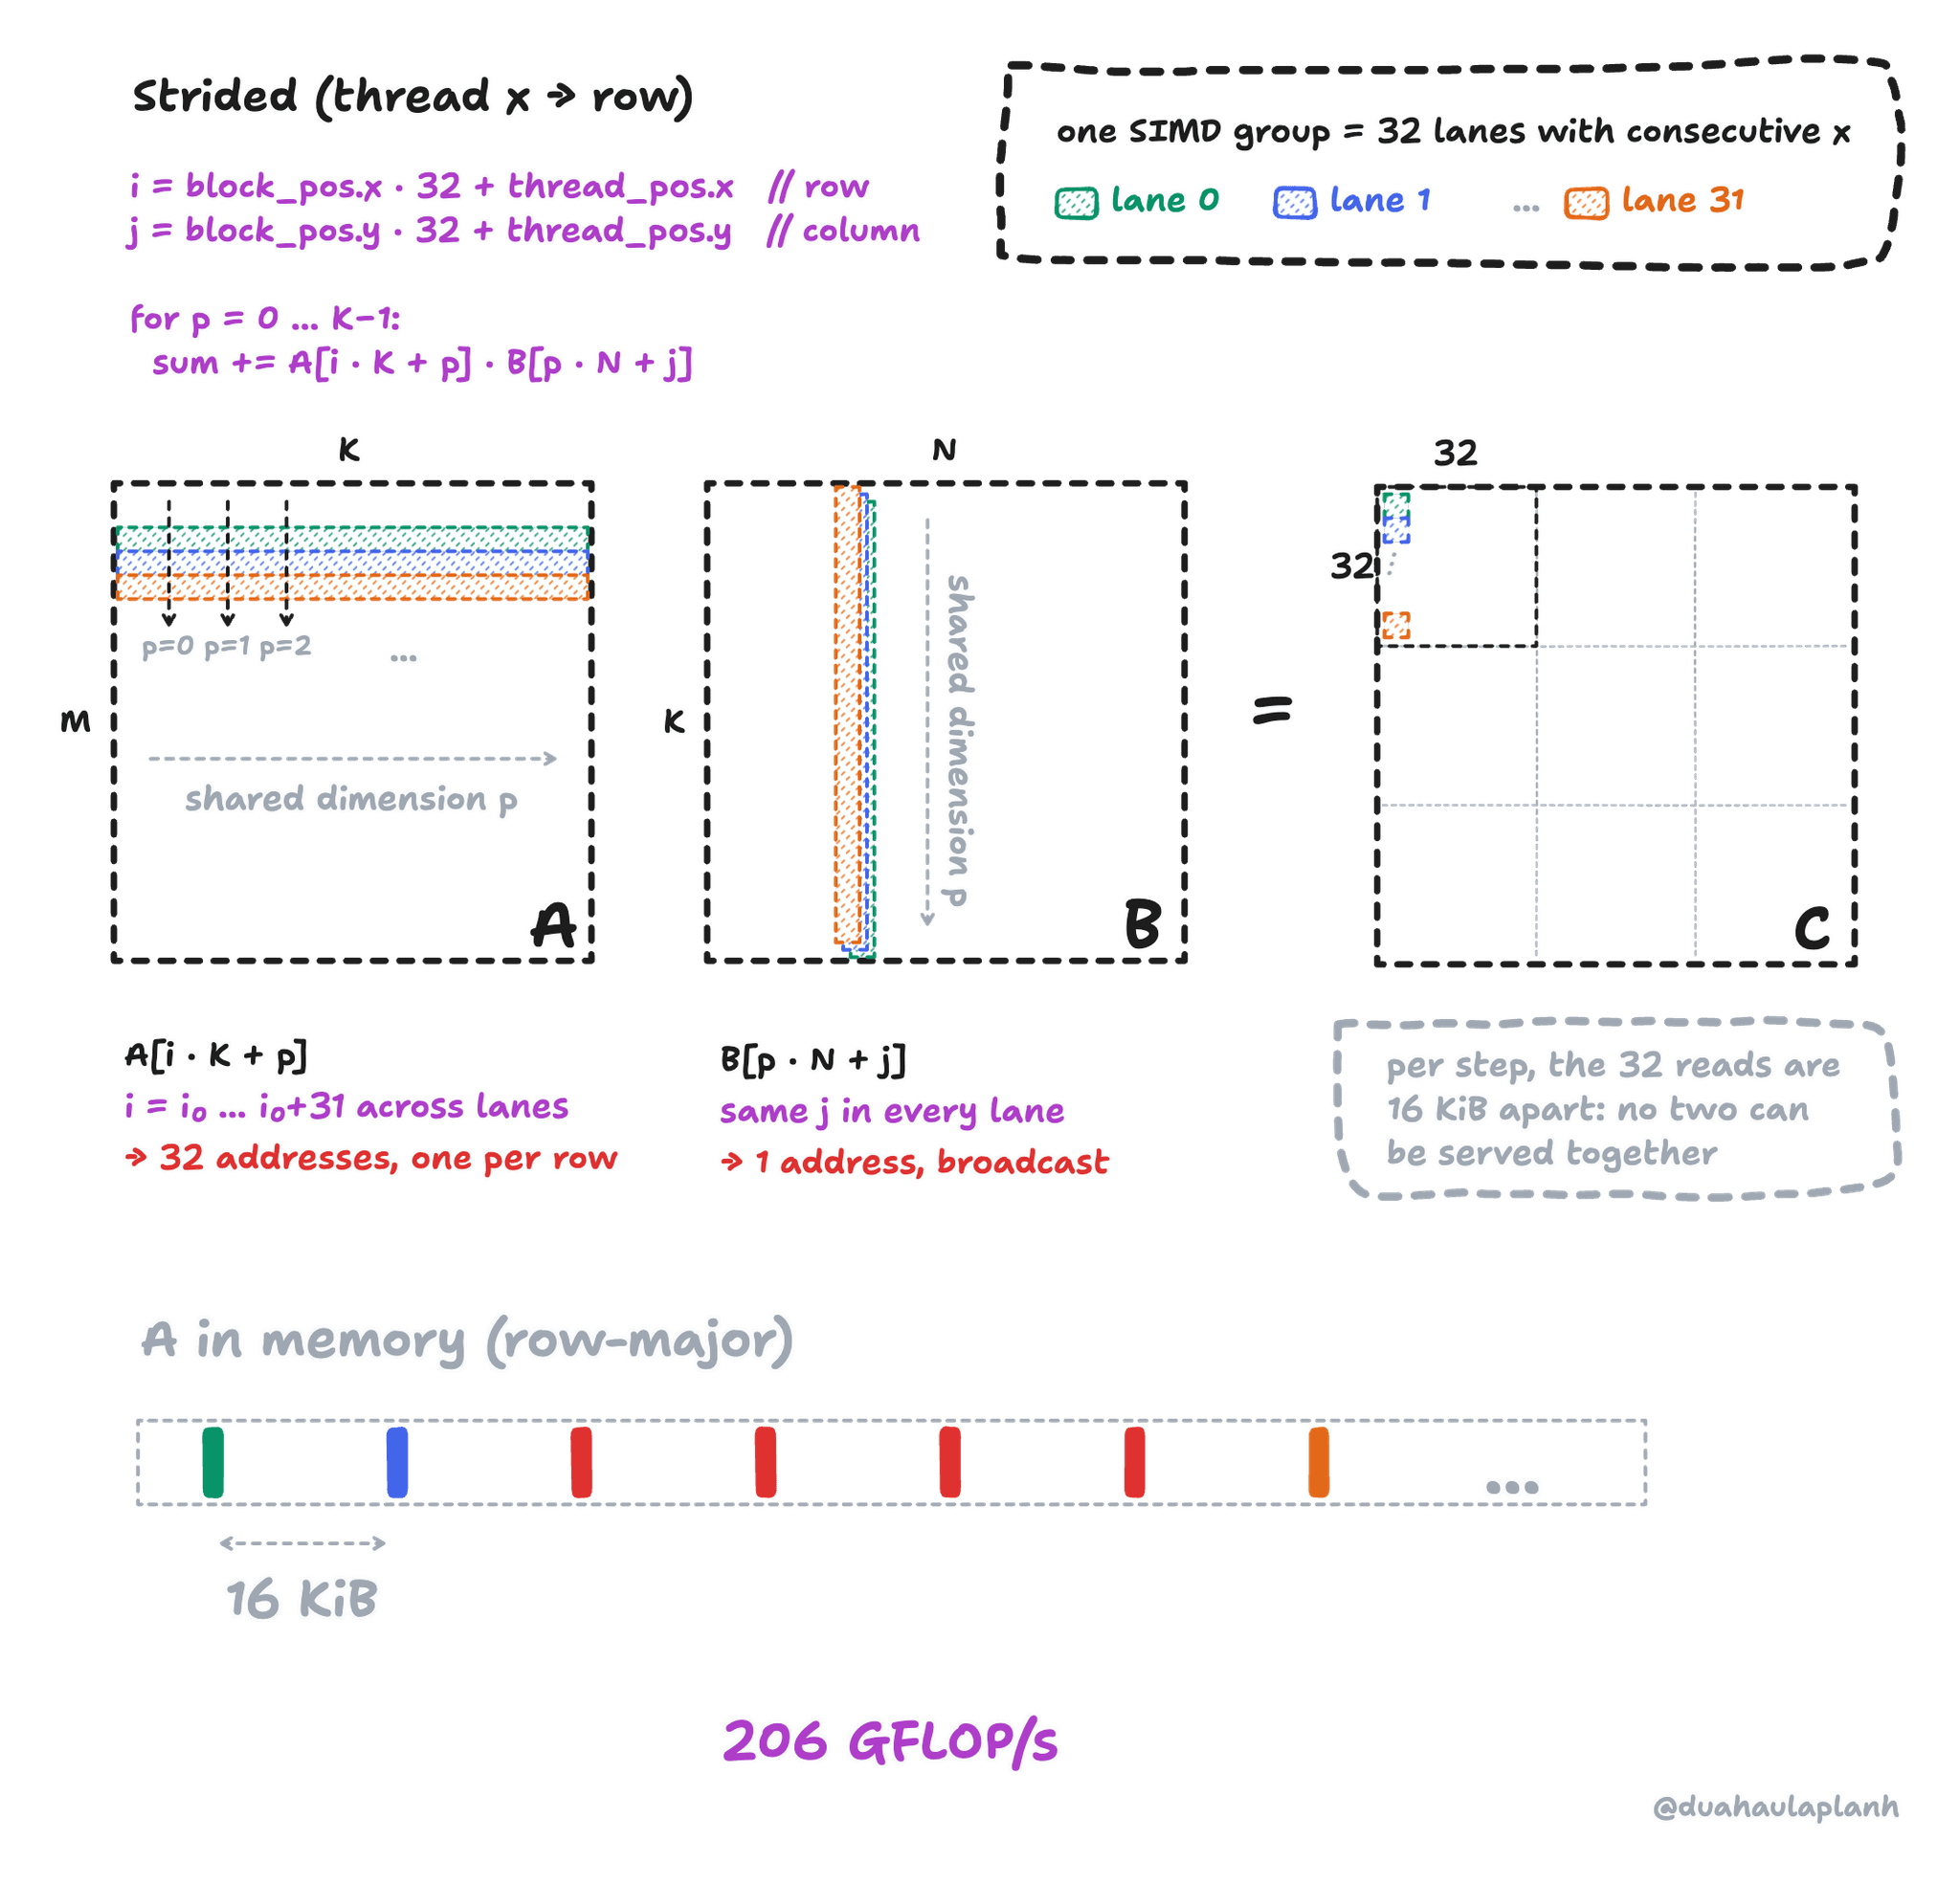
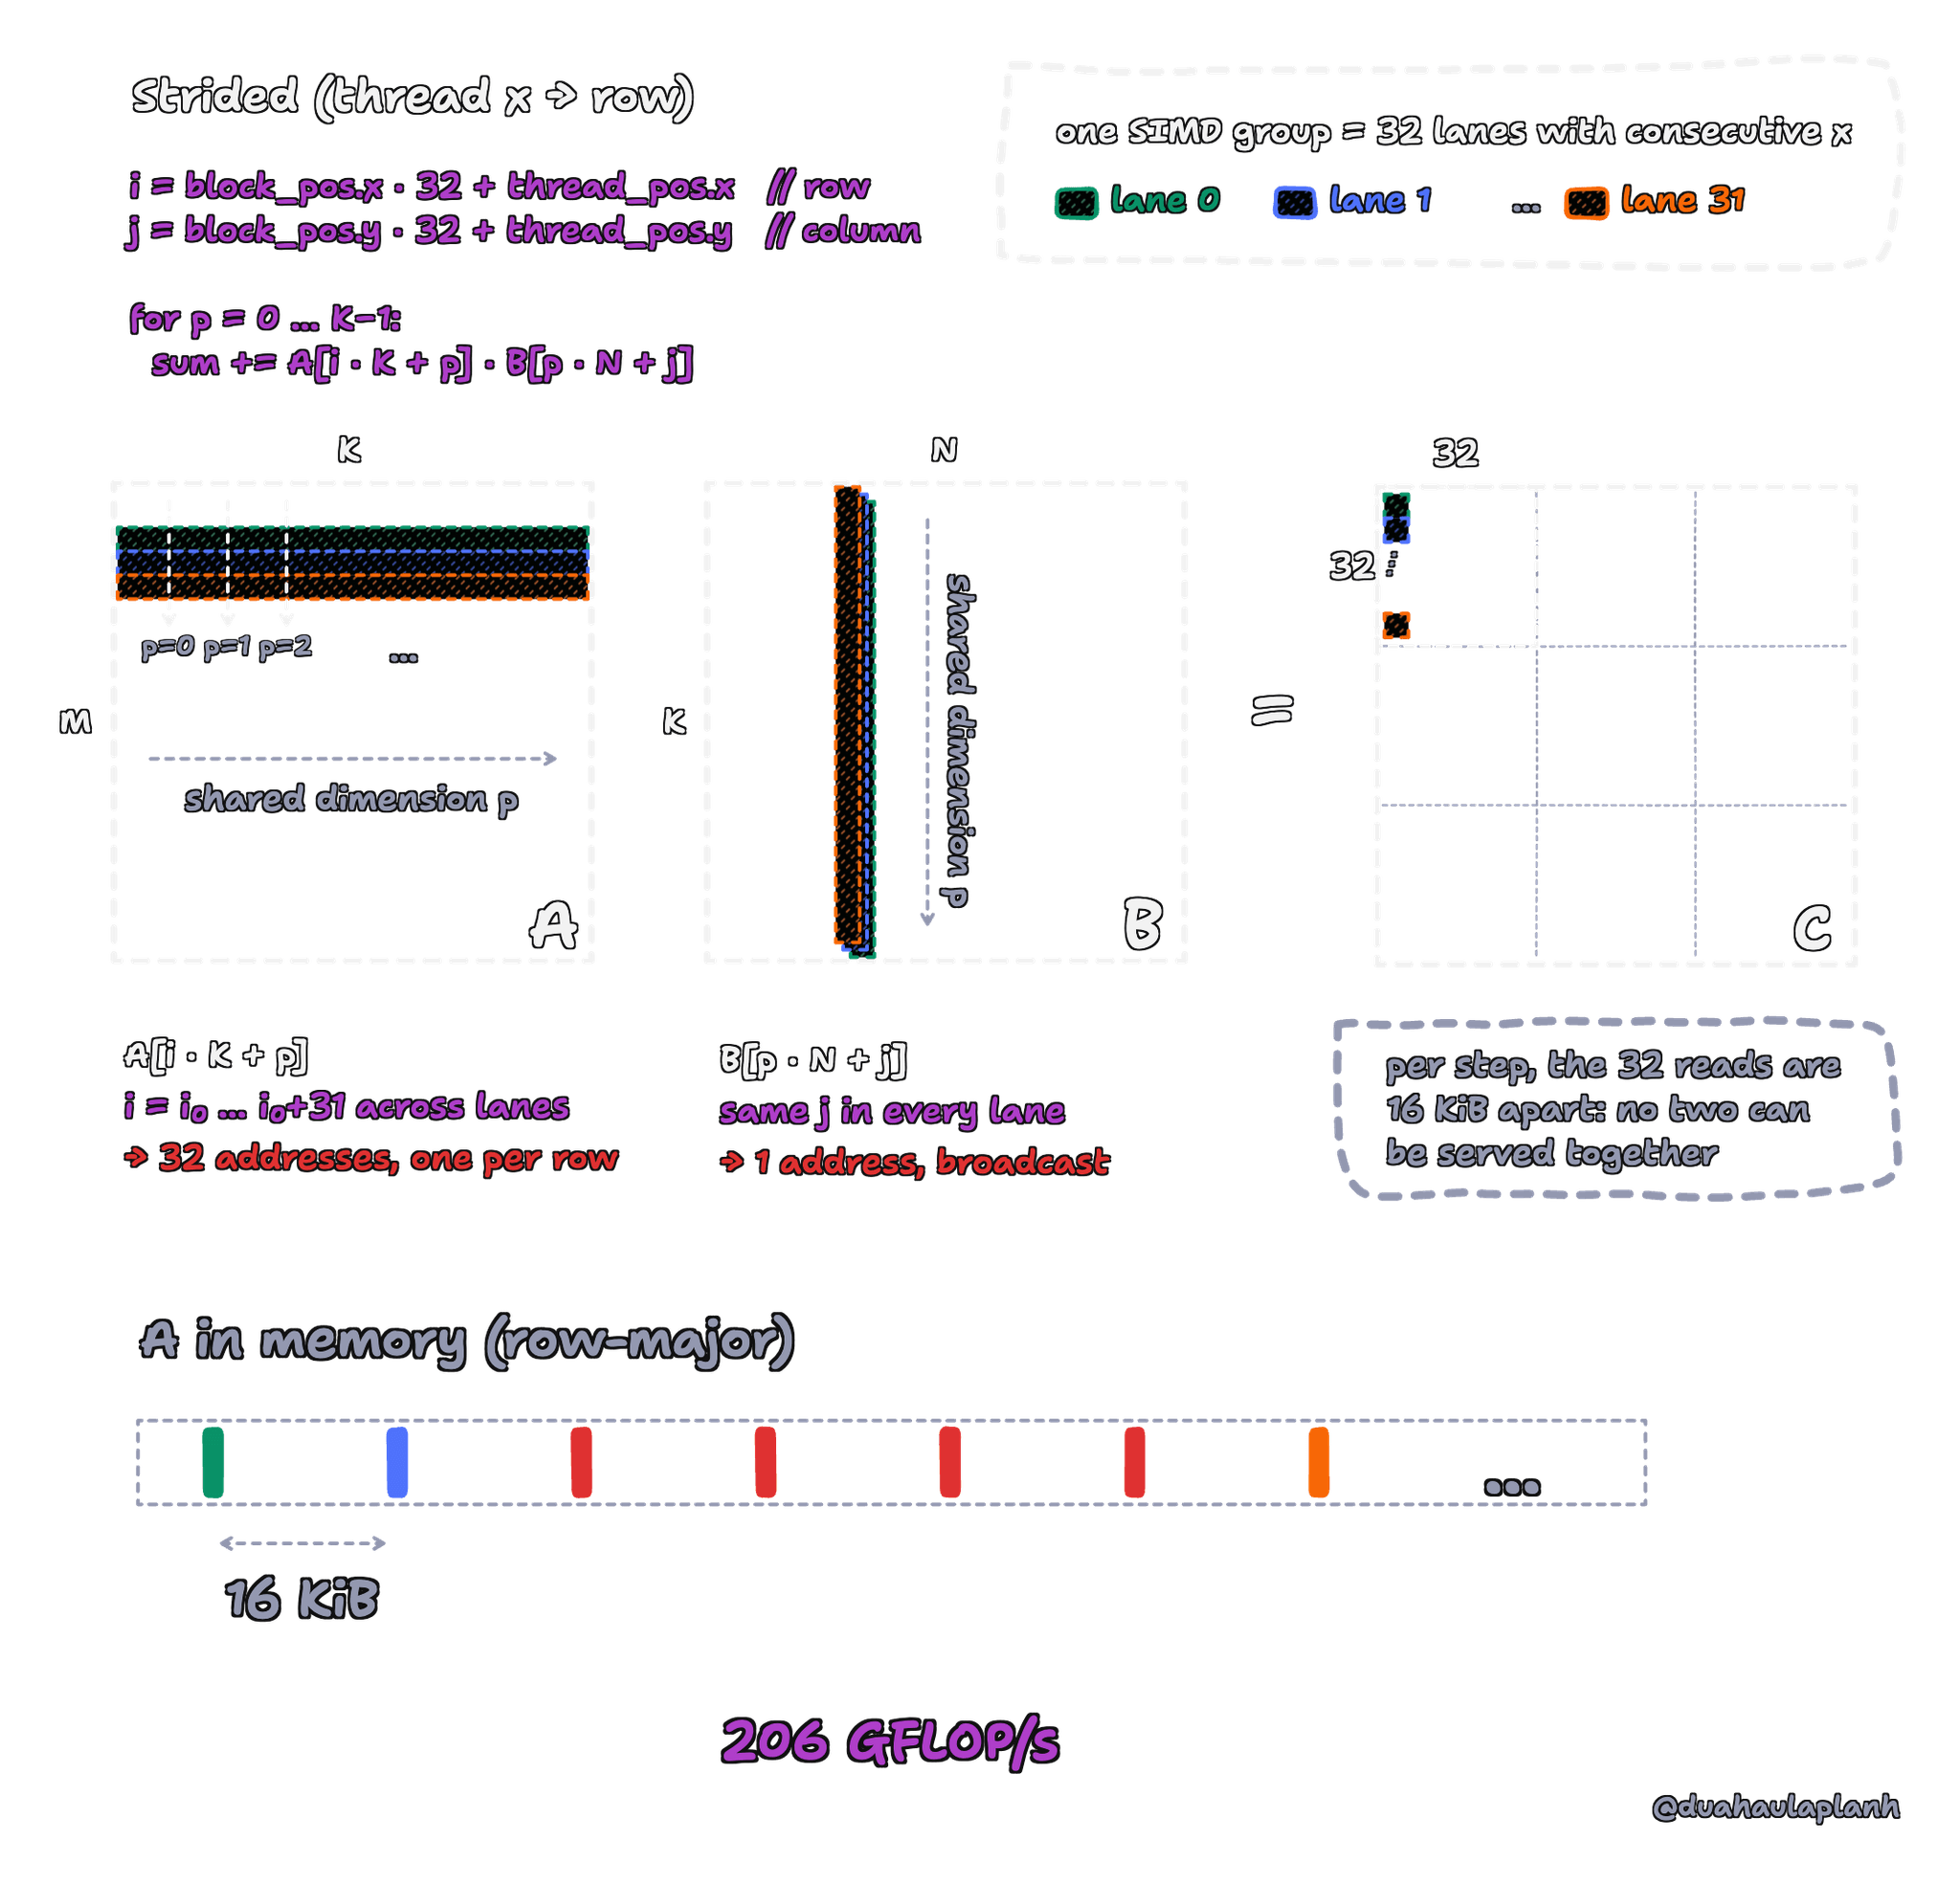
The flipped mapping (thread_pos.x → row). Both mappings issue the same loads and do the same arithmetic.
Important
On NVIDIA GPUs, merging a warp’s neighbouring addresses into a few wide memory transactions is called global memory coalescing. This concept can be transfered effortlessly to Metal.
From our measurement, the naive kernel reached 365 GFLOP/s, which is 9% of the FP32 ceiling and 11% of MPS. So where does the other go? We will move to another important concept in GPU programming: Roofline Analysis.
Roofline Analysis
To answer that, we need a way to say what a kernel could reach before we measure it. The roofline model
Compute Time and Memory Time
A kernel does two kinds of work: it computes (multiplying and adding numbers as in GEMM), and it moves data between memory and the coresThe memory here can be refered to registers, threadgroup memory (or shared memory in CUDA), devices memory (or global memory in CUDA) and even cache too.. Both take time, and our two ceilings tell us the least time each one could take.
Let’s be the number of floating-point operations (FLOPs) that kernel performs and be the number of bytes moved to or from device memoryMetal calls the GPU’s main memory device memory, after the device address space our buffers live in. It plays the role of CUDA’s global memory. For now, “memory” in this section means device memory and its 118 GB/s ceiling. We’ll see soon why that qualifier matters.. Write TFLOP/s for the compute ceiling and GB/s for the memory bandwidth.
If the GPU did nothing but arithmetic at full speed, the arithmetic would take:
If it did nothing but move bytes at full bandwidth, the traffic would take:
A GPU can do both at once: while some SIMD groups wait for their loads, others keep the arithmetic units busy. At best, the slower of the two hides the faster one completely, so:
Whichever term is larger names the kernel’s bottleneck
- If is larger, the kernel is compute-bound: the arithmetic units are the busy part, and memory keeps up.
- If is larger, the kernel is memory-bound: the arithmetic units sit idle, waiting for data.
Example
Let’s use our knowledge to analyze GEMM itself, assuming a “perfect” kernel.
- At each output element, we need multiplications and additions and we have total elements (for output matrix ), so the total number of operations is . We can approximate it as so:
- For , imagine a perfect kernel that reads and once and writes once. For , we need to read total elements, for , we need to read total elements, and for , we need to write total elements. At 4 bytes per
float, it moves:
The arithmetic takes at least ms, and the traffic takes at least ms. The arithmetic floor is twenty times the memory floor, so a well-written GEMM at this size should be compute-bound.
Arithmetic Intensity
Note
We’ll use this concept for every kernel after, so let’s remember this.
If a kernel is compute-bound, then , or . Then we can rearrange the inequality to:
The left side describes how much arithmetic the kernel does for the bytes it transfers and it also has its own name.
The arithmetic intensity of a kernel is the number of FLOPs it performs per byte it moves:
Unless we name another memory level, counts bytes transferred to or from device memory (global memory in CUDA). When we estimate it by counting buffer loads in the code, we’ll first assume every request reaches device memory. Caches can reduce that traffic, so we’ll check the estimate against measurements later.
On the hardware side, is the intensity at which the compute time and memory time are equal. On our M5:
We can understand it this way: in the time the M5 moves one byte from device memory, it can do about 34 FLOPs.
Important (Intensity of GEMM)
The perfect GEMM has a arithmetic intensity of:
which is nearly times what M5 actually needs. For example, arithmetic intensity of square matrices is , so the intensity grows with the matrix size. Therefore, to get the fastest GEMM as we can, we need to raise the intensity near this perfect intensity as much as possible. And that’s maybe wrong, keep increasing arithmetic intensity isn’t the right way, to know why, keep reading and have fun!
Let’s recall the inequality:
Dividing by both sides of the bound on , we get:
If we plot this bound against on log-log axes, we will get the shape that names the model: roofline model. It is a slanted line that rises until it meets the flat line , this is the ridge point.
- A kernel left of the ridge sits under the slanted part of the roof. Raising its intensity raises the bandwidth ceiling. If it already reaches that ceiling, it is memory-bound.
- A kernel right of the ridge sits under the flat part. The FP32 ceiling sets the bound, and more intensity no longer raises it.
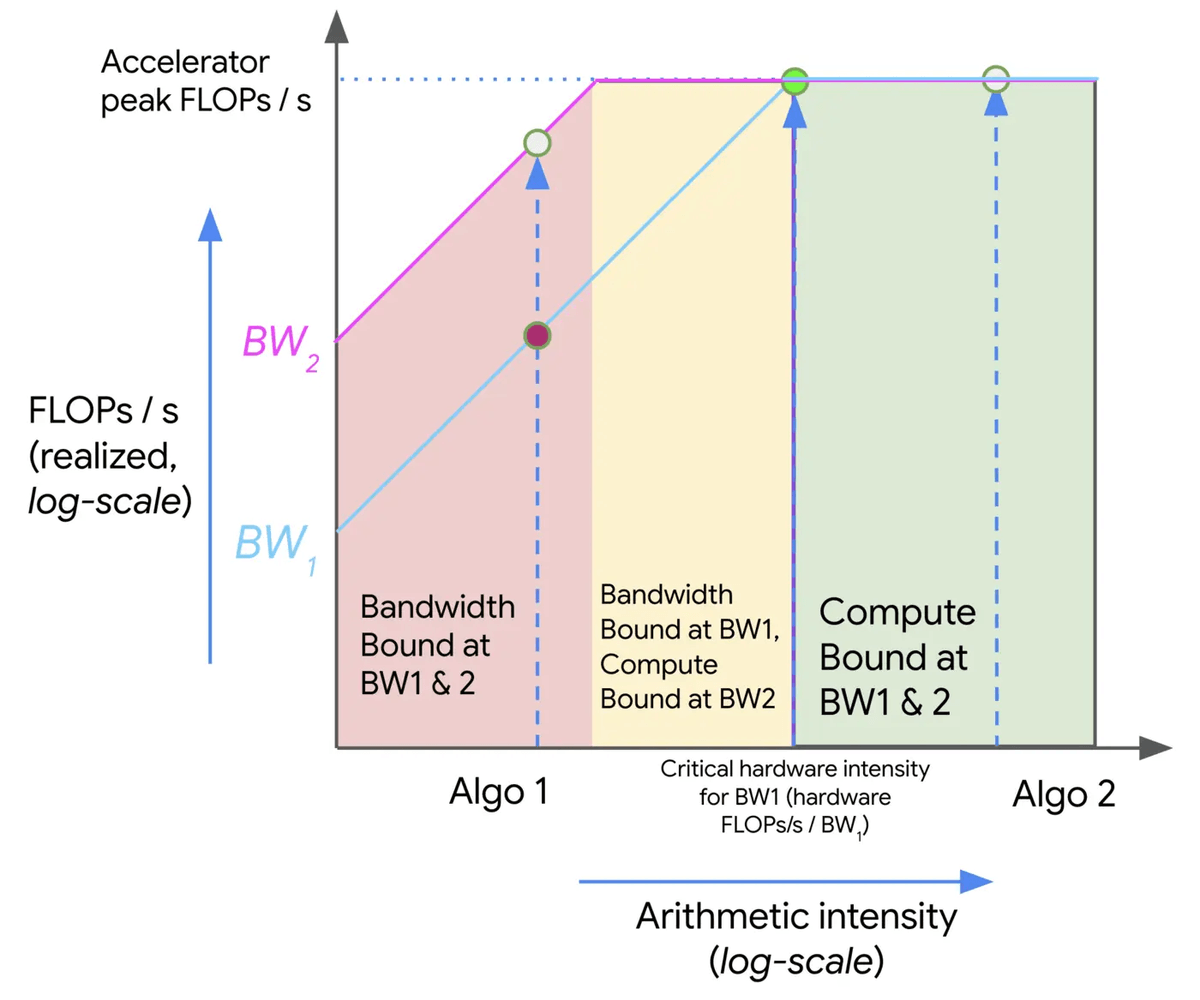
An example roofline plot showing two algorithms with different arithmetic intensities (Algo 1 and Algo 2) and their corresponding theoretical peak throughput under different bandwidths (BW1 and BW2). In the red area, an algorithm is bandwidth bound at both bandwidths and is wasting some fraction of the hardware’s peak FLOPs/s. The yellow area is bandwidth-bound only at the lower bandwidth (BW1). The green area is compute-bound at all bandwidths (I use the same example, figure and phrasing from
The Naive Kernel on the Roofline
Now we go back to the naive kernel’s inner loop (this is where the kernel reads and computes the data):
C++
sum += A[i * K + p] * B[p * N + j];Each iteration does one multiply-add, 2 FLOPs, and asks for two floats, 8 bytes. If every one of those requests went to device memory, the kernel’s intensity would be:
That is only of the perfect kernel’s intensity. With the same arithmetic, naive kernel is spending more than 2700 times on data movement. So “on paper”, our naive kernel is memory-bound.
Put that on the roofline, at 0.25 FLOP/byte, the naive kernel sits far left of the ridge, and its roof is:
But in our benchmark, we measured 365 GFLOP/s, twelve times higher than that roof! A kernel cannot run above its roof, so one of our inputs must be wrong.
Let’s follow the bytes to find out which one. At 365 GFLOP/s, the kernel finishes its 137.4 GFLOP in about 376 ms. In that time, device memory can deliver at most:
But the kernel asks for 550 GB from device memory insteadWe need two floats per multiply-add so the total bytes requested is bytes or GB.. So at least 92% of the loads never reached device memoryEven if we use Apple’s 153 GB/s spec, it only raises the 44 GB to about 58 GB, still barely a tenth of what the kernel asks for. The conclusion doesn’t depend on our measured bandwidth.. It must be the case that almost data has been cached by the GPUThis is an inference from counting loads against measured throughput, not a measured cache hit rate.. So the wrong input was : we counted the bytes the code requests, not the bytes that actually travel from device memory.
Important (Why GPU does the caching for us?)
Recall the access pattern from the coalescing figure. At step , a SIMD group reads one 128-byte span of row of , and the other 31 SIMD groups in its threadgroup read the same span, because they own the same 32 columns. Over the next few steps, the same SIMD group reads , which sit side by side in memory. A cache close to the cores can serve all of those from one trip to device memory.
Our 0.25 FLOP/byte was a no-cache estimate of arithmetic intensity: it assumed every buffer load reached device memory. With the caches absorbing most of those requests, the intensity is at least FLOP/byte. We still count at device memory, the only thing that changed is our estimate of .
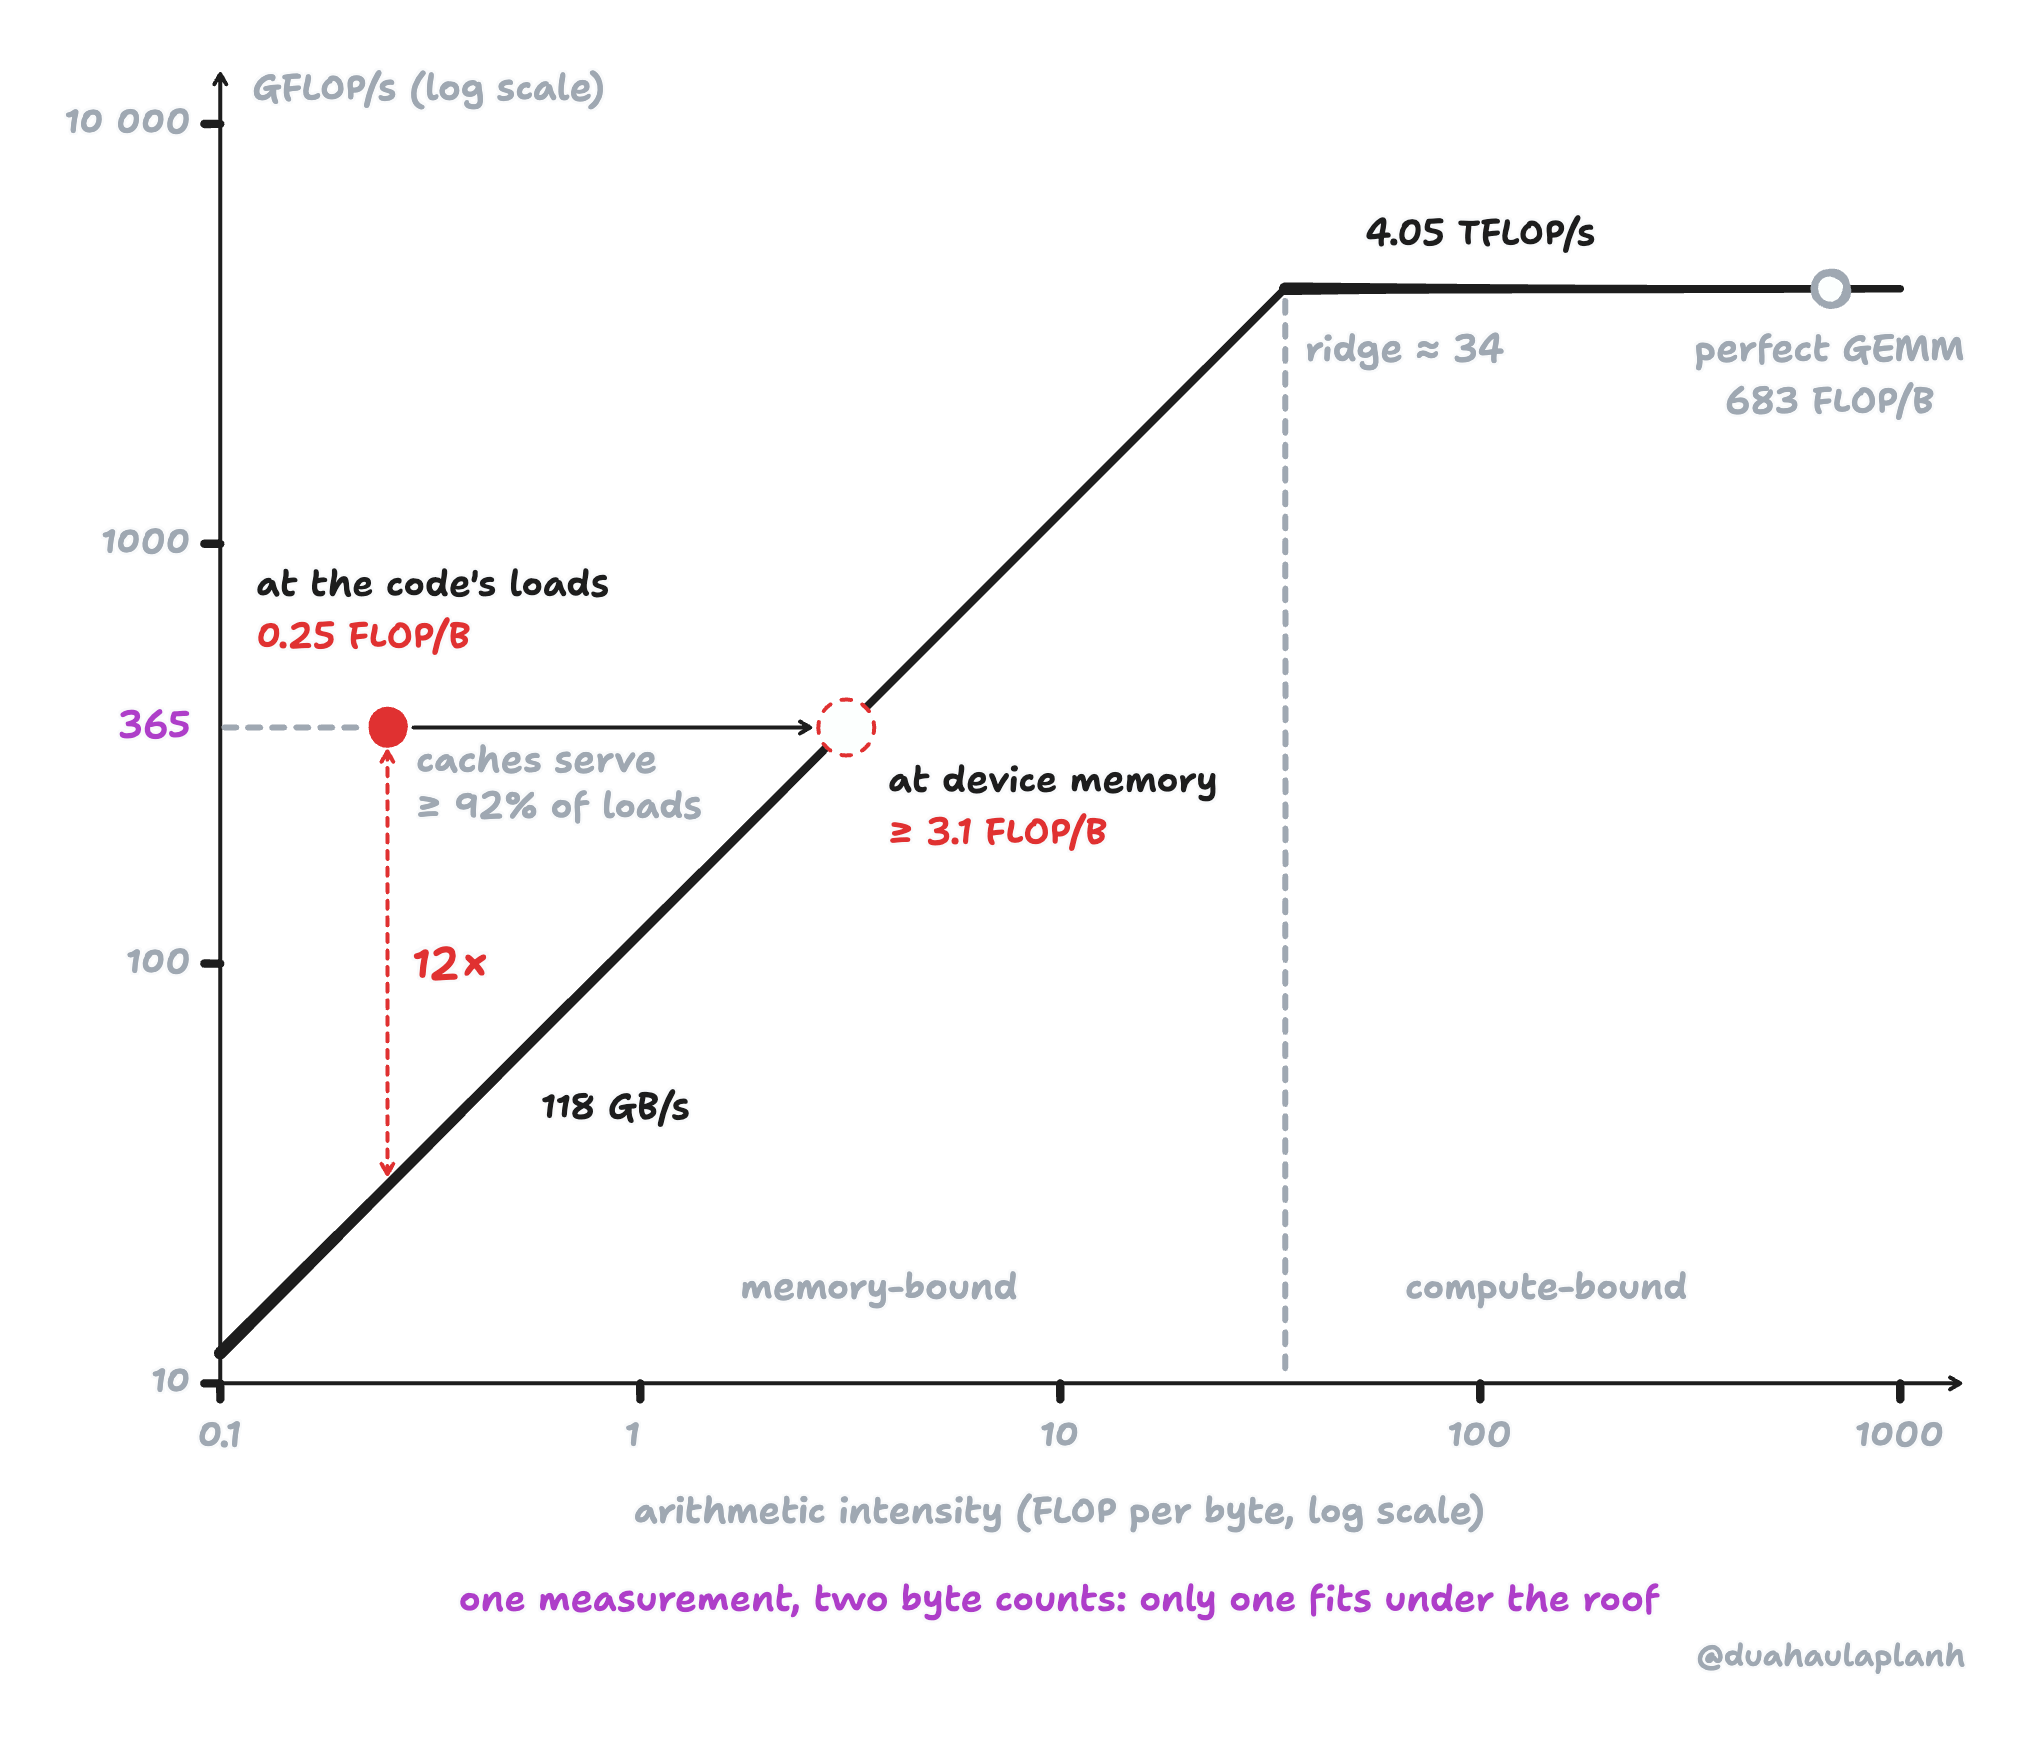
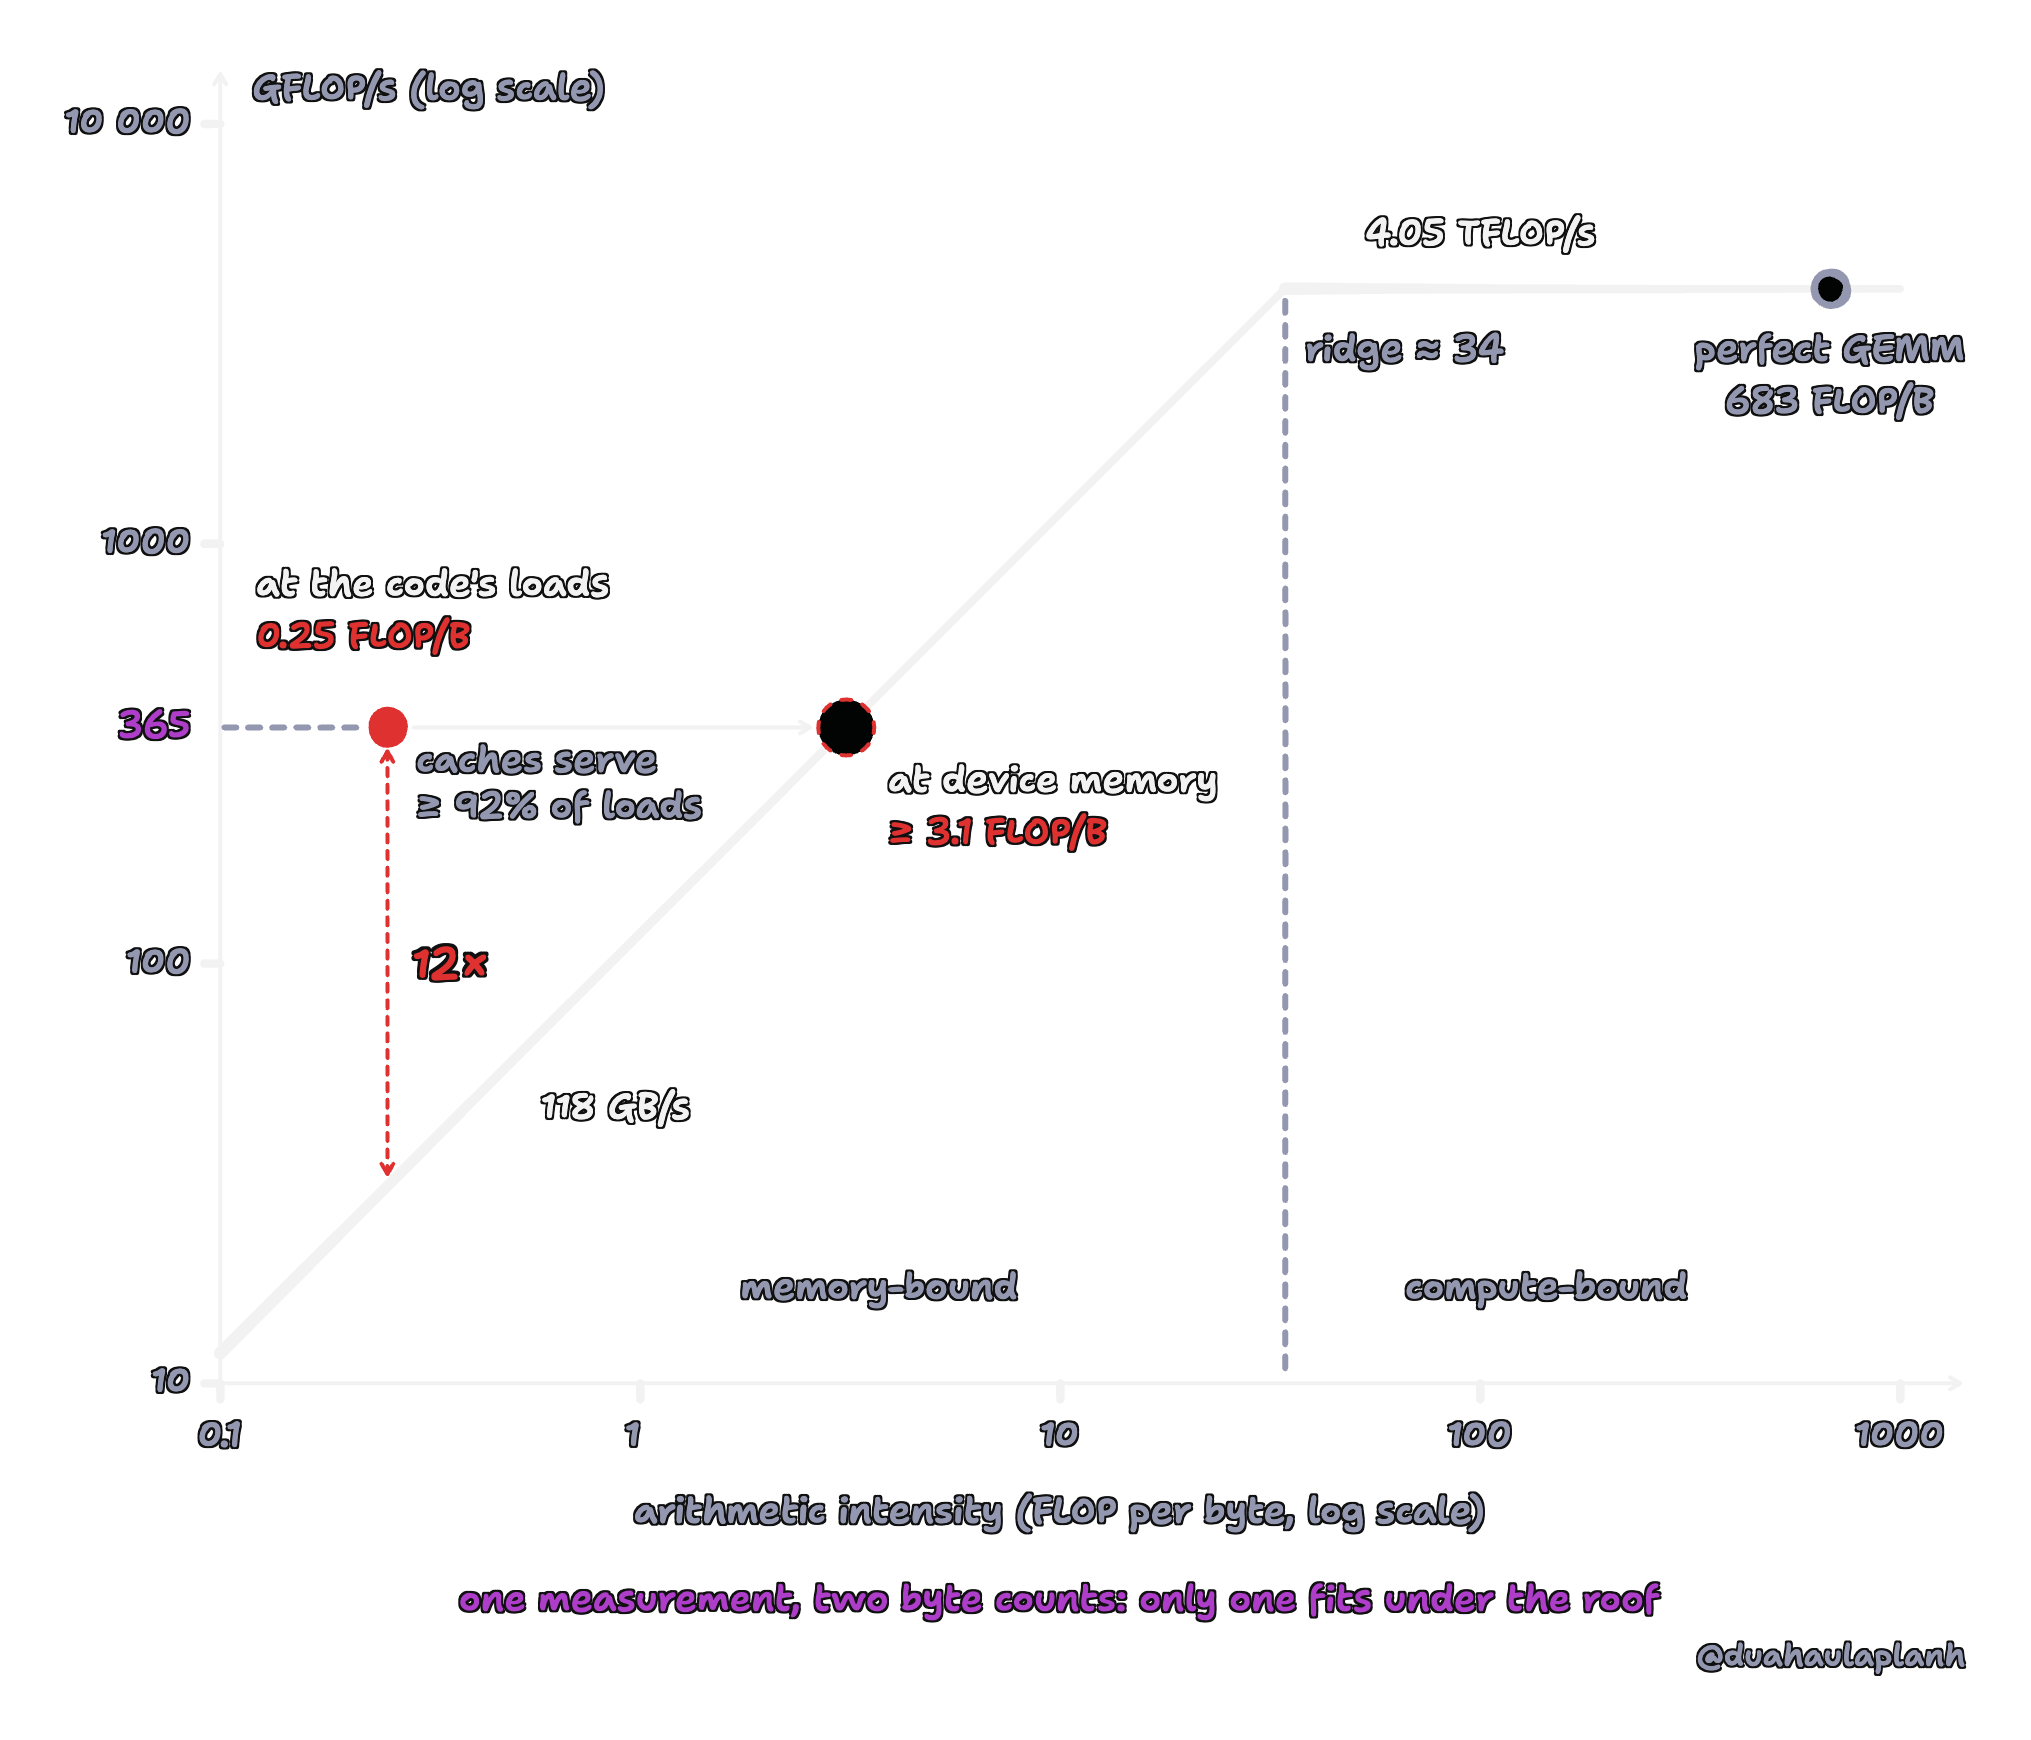
The naive kernel on the M5 roofline, counted two ways. The solid dot uses the bytes the code requests and sits twelve times above its roof. The dashed circle is inferred: it uses the most that device memory could deliver in the measured 376 ms, so its intensity is a lower bound. Both roofs use our measured ceilings.
Profiling the Naive Kernel
Besides analyzing and predicting the kernel performance, we can also ask the GPU. Like Nsight Compute on NVIDIA GPUs, Apple’s Instruments can read the GPU’s performance counters while our kernel runsprobes/profile_kernel.sh in the repository records a Metal System Trace with Instruments’ “Performance Limiters” counter set and averages each counter over our kernel’s GPU time. xctrace has no public option for the counter set, so the script patches Xcode’s template. The counters are sampled for the whole GPU, not per kernel, so keep the machine idle while profiling. The script also times the GPU alone, so its GFLOP/s are a little higher than our tables, which come from the harness and include encoding and submitting the work.. Here is the report for the naive kernel:
| Counter | Value |
|---|---|
| GFLOP/s (median of 3 iterations) | 376 |
| GPU time over all iterations | 1095.9 ms |
| Kernel Occupancy | 97.51 % |
| Compute SIMD Groups Inflight | 93.61 |
| Instruction Throughput Limiter | 61.30 % |
| Instruction Throughput Utilization | 20.46 % |
| ALU Utilization | 22.76 % |
| F32 Limiter | 9.20 % |
| F32 Utilization | 9.14 % |
| Integer and Conditional Limiter | 36.08 % |
| Integer and Conditional Utilization | 27.28 % |
| Control Flow Limiter | 19.09 % |
| L1 Cache Limiter | 6.81 % |
| L1 Cache Utilization | 6.81 % |
| ThreadGroup L1 Read Accesses | 0.00 % |
| Buffer L1 Read Accesses | 99.88 % |
| Threadgroup Memory L1 Read Bandwidth | 0.00 GiB/s |
| Buffer L1 Read Bandwidth | 788.22 GiB/s |
| Buffer L1 Miss Rate | 18.60 % |
| Last Level Cache Limiter | 25.45 % |
| Last Level Cache Bandwidth | 196.59 GB/s |
| GPU Read Bandwidth | 120.03 GB/s |
| Register Pressure Influence | 0.00 % |
| Register spills | none |
A utilization counter is the share of a unit’s peak work that was actually done and a limiter counts the time the unit tried to work but was stalledThese are Apple’s definitions, which Instruments prints with each counter. For example, “F32 Utilization: Measures the time during which F32 work is executed as a percentage of peak F32 performance”.. For now, we can see three lines:
F32 Utilizationis 9.1%: the FP32 units do 9% of the work they could, the same 9% of the FP32 ceiling our stopwatch gave.Buffer L1 Miss Rateis 18.6%: the L1 cache inside each core answers about four out of five buffer reads.GPU Read Bandwidthis 120 GB/s: what gets past the GPU’s caches is read from memory outside the GPUApple describes this counter as reads “from a memory external to the GPU (potentially device memory)”, so it may include the system-level cache that the GPU shares with the CPU. at our device-memory ceiling of 118 GB/sAs we mentioned before, 118 GB/s is our estimated from measurements, not the real value and it isn’t different much from the real value (120 GB/s)..
Over one 366 ms run, 120 GB/s is about 44 GB, this is the most requests that device memory can deliver. So the dashed circle in our naive kernel roofline figure is where the naive kernel really sits. The caches absorb over 90% of its loads, and the rest saturate device memory.
Areas of Improvement
Every kernel in the rest of this post performs the same 137.4 GFLOP. What we can change is how many bytes each FLOP costs: we can raise the kernel’s intensity toward the 683 that GEMM allows. The perfect kernel gets there by loading each input value once and reusing it thousands of times from somewhere fast. Every optimization in this post is a way of getting closer to that reuse.
Back to the question the first result raised: can threads working on nearby outputs share input values on purpose instead of hoping the cache does it for them? Our next kernel answers it with tiling.
Kernels 2 and 3: Shared Memory Tiling
Note
Thank Apple for cache optimization but we won’t rely on it. Our next kernel asks for this cache reuse explicitly. Before we change any code, let’s count how much reuse there is to get.
Look again at one threadgroup of the naive kernel. In order to compute that threadgroup’s final output, we need a a block of from and a block of from . So the threadgroup needs:
Now let’s look how our naive kernel acquires these elements. The 32 threads in a row of the threadgroup share the same row , so they all walk along the same row of . The 32 threads in a column share the same column , so they all walk down the same column of . Over the whole loop, the threadgroup asks for:
So although we only need 262K different elements, our naive kernel asks for 8.4M loads, that means for each element, it is read 32 times. If the threadgroup has size , then this is times and it is increasing linearly with the threadgroup size.
Our tiled kernel still keeps everything from the naive kernel: the same threadgroup, and each thread still owns one element of , so thread of threadgroup still computes . The only thing we change is where the inputs come from so we can control it. Each value is:
- Loaded from a device buffer once per threadgroup.
- Then kept on the core.
- Finally read by all the threads that need it.
To keep values on the core, we need a place that every thread in the threadgroup can write to and read from. Metal calls it threadgroup memoryCUDA calls it shared memory and declares it with __shared__. Metal marks it with the threadgroup address space, the same way device marks our buffers. Besides being a place that all threads in the same block can work with, it is also faster to access than global memory., and we declare it inside the kernel:
C++
threadgroup float A_shmem[32 * 32];Every thread in the threadgroup sees the same A_shmem, and it lives only as long as the threadgroup does. Threads in other threadgroups can’t see it.
Note
Since M3, Apple stores registers, threadgroup memory, and cached buffer data in the same on-core caches, and assigns that storage to whichever kind a kernel uses
Two tiles of float need KiB so it is well under the limit.
But why do we need threadgroup memory? It gives us control: we decide what stays on the core and for how long, instead of hoping the cache decides the same wayIn CUDA, without any help from caching, the pain point of the naive kernel is that it reads the same element many times, and each read is a trip to global memory, which is expensive. So we change the destination of the trip from global memory to the core. Shared memory has lower latency and higher bandwidth than global memory, which makes each trip cheaper. This is the same idea in PMPP
Tiling the Loop over K
Let’s go back to the loops, as we did for the naive kernel. Each thread still computes one dot product of length , but now we cut that dot product into phases of steps. In each phase, the threadgroup copies a tile of and a tile of into threadgroup memory, and every thread does multiply-adds from the tiles:
Code
for each threadgroup (bCol, bRow) in parallel: for each thread (tCol, tRow) in parallel: # the element of C this thread owns i = bRow*T + tRow j = bCol*T + tCol sum = 0 # one phase per pair of tiles for ph = 0, T, 2T, ..., K-T: # each thread loads one element of A A_shmem[tRow, tCol] = A[i, ph + tCol] # and one element of B B_shmem[tRow, tCol] = B[ph + tRow, j] wait until the whole threadgroup has loaded for k = 0, ..., T-1: # = A[i, ph+k] * B[ph+k, j] sum += A_shmem[tRow, k] * B_shmem[k, tCol] wait until the whole threadgroup has finished reading C[i, j] = sumAcross all phases, visits every index from to exactly once, so sum ends up as the same dot product as in the naive kernel. The difference is who loads what. With threads and two tiles, each thread loads exactly one element of each tile, and then reads elements that other threads loaded.
![Top: A times B equals C for threadgroup (2, 1) with 32 by 32 tiles. Its rows 32 to 63 of A and columns 64 to 95 of B are shaded blue. At phase ph = 64, the current 32 by 32 tile of each is shaded red; after each of the 128 phases, pointer A moves one tile right (A += 32) and pointer B one tile down (B += 32 · N), while pointer C stays on the threadgroup's tile of C. Bottom: the two tiles copied into threadgroup memory as A_shmem and B_shmem, one element per thread. Thread (29, 3) reads row 3 of A_shmem and column 29 of B_shmem to accumulate C[35, 93], which is stored after the last phase. Each value is loaded once from device memory and read 32 times from threadgroup memory.](/_vercel/image?url=_astro%2Ftiling-along-k-light.CDEGYWRr.png&w=2048&q=100)
![Top: A times B equals C for threadgroup (2, 1) with 32 by 32 tiles. Its rows 32 to 63 of A and columns 64 to 95 of B are shaded blue. At phase ph = 64, the current 32 by 32 tile of each is shaded red; after each of the 128 phases, pointer A moves one tile right (A += 32) and pointer B one tile down (B += 32 · N), while pointer C stays on the threadgroup's tile of C. Bottom: the two tiles copied into threadgroup memory as A_shmem and B_shmem, one element per thread. Thread (29, 3) reads row 3 of A_shmem and column 29 of B_shmem to accumulate C[35, 93], which is stored after the last phase. Each value is loaded once from device memory and read 32 times from threadgroup memory.](/_vercel/image?url=_astro%2Ftiling-along-k-dark.DHUE-0ly.png&w=2048&q=100)
One phase of the tiled kernel for threadgroup with , at . Top: the threadgroup’s rows of and columns of (blue), this phase’s tiles (red), and where the pointers A, B, and C point (violet). Bottom: the same tiles in threadgroup memory, where thread reads row 3 of A_shmem and column 29 of B_shmem for . Layout adapted from
Important (Counting the loads)
Per phase, a threadgroup requests floats from the device buffers. There are phases, so a threadgroup requests:
times fewer than the naive threadgroup’s . For , that is floats: exactly the number of different floats we counted above, so each one is loaded once.
Across the grid, the threadgroups request:
which is 34.4 GB for and 17.2 GB for , against the naive kernel’s 550 GB. Assuming every request reaches device memory, our intensity estimate becomes:
4 FLOP/byte for and 8 for . These are no-cache estimates, both still left of the ridge at 34.
Keep that in mind. Going from to tiles halves the bytes requested from the device buffers. If those requests all reached device memory and its bandwidth still set the time, the kernel should run close to twice as fast. We’ll check that prediction at the end of this section.
Implementation
Note
The template parameters BLOCK_M and BLOCK_N are the tile’s height and width, and matmul_tiling_mnk16 and matmul_tiling_mnk32 in the table set both to 16 and 32. We launch it like the naive kernel: threads per threadgroup and threadgroups.
C++matmul_tiling
template <uint BLOCK_M, uint BLOCK_N>kernel void matmul_tiling(device const float* A [[buffer(0)]], device const float* B [[buffer(1)]], device float* C [[buffer(2)]], uint M, uint N, uint K, uint2 block_pos [[ threadgroup_position_in_grid ]], uint2 thread_pos [[ thread_position_in_threadgroup ]]){ // one element of A and one of B per thread only works for a square tile static_assert(BLOCK_M == BLOCK_N, "BLOCK_M must equal BLOCK_N");
uint bRow = block_pos.y; uint bCol = block_pos.x; uint tRow = thread_pos.y; uint tCol = thread_pos.x;
// 1. allocate threadgroup memory and move the pointers threadgroup float A_shmem[BLOCK_M * BLOCK_N]; threadgroup float B_shmem[BLOCK_M * BLOCK_N];
A += bRow * BLOCK_M * K; // A now starts at row bRow * BLOCK_M B += bCol * BLOCK_N; // B now starts at column bCol * BLOCK_N C += bRow * BLOCK_M * N + bCol * BLOCK_N; // C now starts at our tile's top-left corner
float sum = 0.f; for (uint ph = 0; ph < K; ph += BLOCK_N) { // 2. collaboratively load one tile of A and one tile of B A_shmem[tRow * BLOCK_N + tCol] = A[tRow * K + tCol]; B_shmem[tRow * BLOCK_N + tCol] = B[tRow * N + tCol]; threadgroup_barrier(mem_flags::mem_threadgroup); // wait until both tiles are full
// 3. collaboratively compute from the tiles for (uint k = 0; k < BLOCK_N; ++k) { sum += A_shmem[tRow * BLOCK_N + k] * B_shmem[k * BLOCK_N + tCol]; } threadgroup_barrier(mem_flags::mem_threadgroup); // wait until everyone is done reading
// 4. slide both tiles along K A += BLOCK_N; B += BLOCK_N * N; }
// 5. write the result C[tRow * N + tCol] = sum;}![Toy problem with 4 by 4 matrices A, B and C split into 2 by 2 tiles. Threadgroup (1, 1) owns rows 2 and 3 of A, columns 2 and 3 of B, and the bottom-right tile of C, shaded blue; its thread (0, 1) owns C[3, 2]. Violet arrows move pointer A by 8 elements from A[0, 0] to A[2, 0], pointer B by 2 from B[0, 0] to B[0, 2], and pointer C by 10 from C[0, 0] to C[2, 2], matching A += bRow · T · K = 8, B += bCol · T = 2, and C += bRow · T · N + bCol · T = 10.](/_vercel/image?url=_astro%2Ftoy-pointers-light.CLWw8m-c.png&w=1920&q=100)
![Toy problem with 4 by 4 matrices A, B and C split into 2 by 2 tiles. Threadgroup (1, 1) owns rows 2 and 3 of A, columns 2 and 3 of B, and the bottom-right tile of C, shaded blue; its thread (0, 1) owns C[3, 2]. Violet arrows move pointer A by 8 elements from A[0, 0] to A[2, 0], pointer B by 2 from B[0, 0] to B[0, 2], and pointer C by 10 from C[0, 0] to C[2, 2], matching A += bRow · T · K = 8, B += bCol · T = 2, and C += bRow · T · N + bCol · T = 10.](/_vercel/image?url=_astro%2Ftoy-pointers-dark.Fa82BKtg.png&w=1920&q=100)
Section 1 on a toy problem, after A30 is . The violet arrows are the pointer moves: A by 8 elements to , B by 2 to , and C by 10 to .
![The same toy problem, sections 2 to 4 stacked. Section 2 at ph = 0: the red tile of A (A20, A21, A30, A31) and the red tile of B (B02, B03, B12, B13) are copied into A_shmem and B_shmem, one element per thread; thread (x, y) copies A_shmem[y, x] and B_shmem[y, x], so thread (0, 1) copies A30 and B12; then threadgroup_barrier waits until both tiles are full. Section 3: thread (0, 1) walks row 1 of A_shmem and column 0 of B_shmem, sum += A_shmem[1, k] · B_shmem[k, 0] for k = 0 and 1, so at ph = 0 the sum is A30 · B02 + A31 · B12; the other three threads read other rows and columns of the same tiles; then threadgroup_barrier waits until everyone is done reading. Section 4: pointer A moves right by BLOCK_N = 2 to A[2, 2] and pointer B moves down by BLOCK_N · N = 8 to B[2, 2]; repeating sections 2 and 3 at ph = 2 adds A32 · B22 + A33 · B32, so C[3, 2] = A30 · B02 + A31 · B12 + A32 · B22 + A33 · B32.](/_vercel/image?url=_astro%2Ftoy-phase-light.DrpfCqZR.png&w=1920&q=100)
![The same toy problem, sections 2 to 4 stacked. Section 2 at ph = 0: the red tile of A (A20, A21, A30, A31) and the red tile of B (B02, B03, B12, B13) are copied into A_shmem and B_shmem, one element per thread; thread (x, y) copies A_shmem[y, x] and B_shmem[y, x], so thread (0, 1) copies A30 and B12; then threadgroup_barrier waits until both tiles are full. Section 3: thread (0, 1) walks row 1 of A_shmem and column 0 of B_shmem, sum += A_shmem[1, k] · B_shmem[k, 0] for k = 0 and 1, so at ph = 0 the sum is A30 · B02 + A31 · B12; the other three threads read other rows and columns of the same tiles; then threadgroup_barrier waits until everyone is done reading. Section 4: pointer A moves right by BLOCK_N = 2 to A[2, 2] and pointer B moves down by BLOCK_N · N = 8 to B[2, 2]; repeating sections 2 and 3 at ph = 2 adds A32 · B22 + A33 · B32, so C[3, 2] = A30 · B02 + A31 · B12 + A32 · B22 + A33 · B32.](/_vercel/image?url=_astro%2Ftoy-phase-dark.DXT_MVZa.png&w=1920&q=100)
Section 2, at : each thread copies one element of each red tile into threadgroup memory (collaborative loading), so thread copies and . Section 3: it walks row 1 of A_shmem and column 0 of B_shmem, adding to sum, while the other threads read other rows and columns of the same tiles. Section 4: both tiles slide to , and repeating sections 2 and 3 there completes . At full size, the device loads in section 2 are coalesced: each SIMD group is one row of the threadgroup, so its 32 lanes read 32 neighbouring floats of a row of and of a row of .
Note
What if our matrix size isn’t divisible by tile width? Then some threads will be out of range and we need to handle them specially. This is an exercise for you to try. Here is an hint, out of range threads will load zeros instead so the sum won’t be affected.
Barrier Synchronization
Note
Until now, every thread worked alone. In the naive kernel, a thread read its own row and column, wrote its own output, and never needed anything another thread did. For the tiling kernel, at step in section 3, our thread reads B_shmem[k, 29], which thread copied there in section 2. Over its 32 steps, our thread reads values copied by 32 different threads, one from every row of the threadgroup.
And those threads don’t run in lockstep. The threads of our threadgroup run as 32 SIMD groups, one per row, and the GPU schedules those SIMD groups independently: one can be many instructions ahead of another, and we don’t control the order. If SIMD group 3 (ours) reaches section 3 before SIMD group 20 has written its row of B_shmem, our thread reads whatever was there before: the previous phase’s tile, or garbage in the first phase.
Each thread needs a way to wait for each other. In Metal it is one function call:
C++
threadgroup_barrier(mem_flags::mem_threadgroup);When a thread calls it, the thread is held at that line until every thread in its threadgroup has reached the same line, and then all of them continueLet’s think we have a group of friends who drive to a mall together that each will shop in a different store, but the car leaves only when everyone is back. Without the barrier, someone gets left at the mall. Below is PMPP’s illustration for threads synchronization.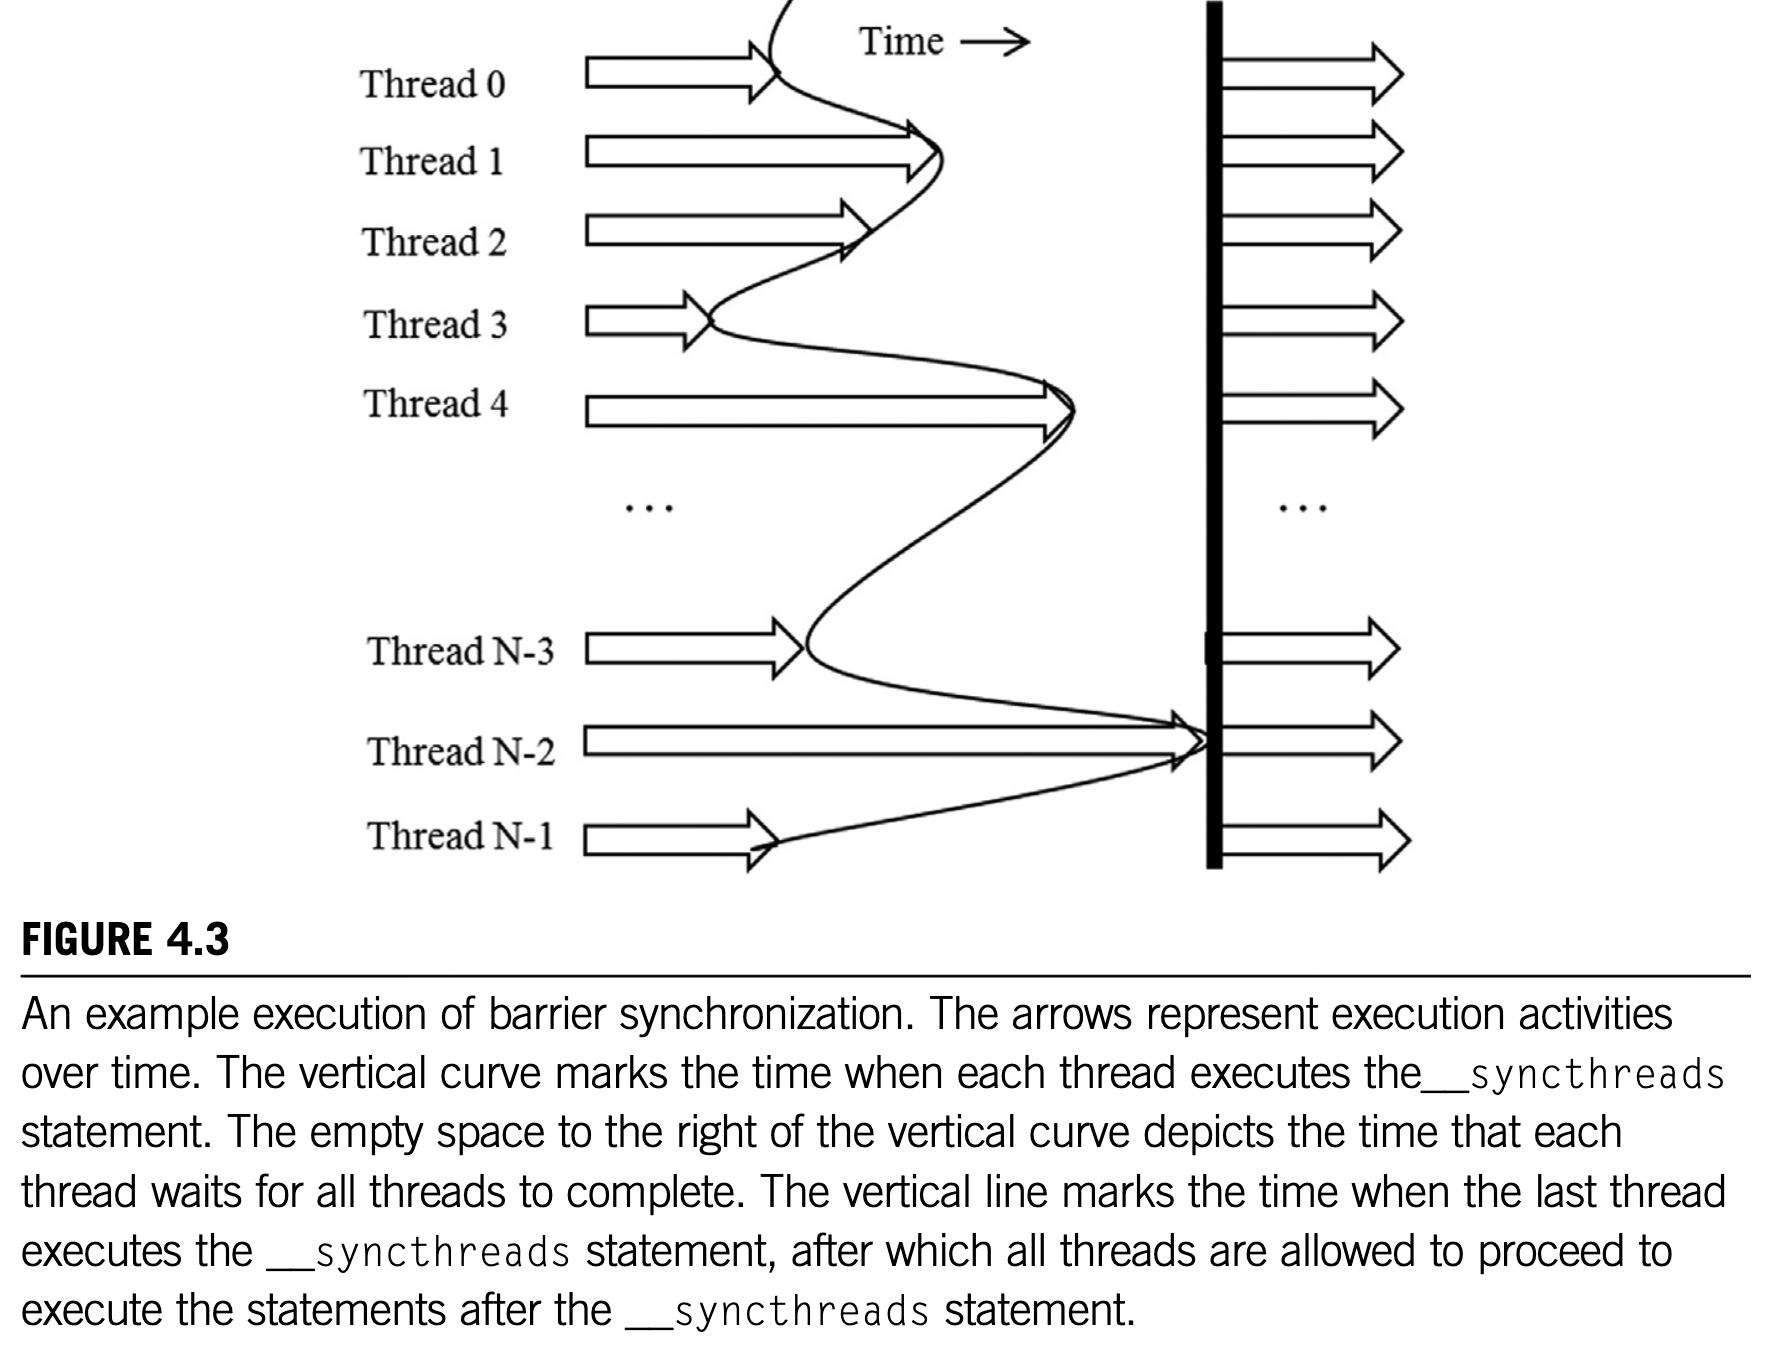 . The
. The mem_flags flag adds a guarantee about memory: every write to threadgroup memory made before the barrier is visible to every thread in the threadgroup after itCUDA’s __syncthreads() does both at once. In Metal, the flag chooses which memory the barrier covers: mem_threadgroup for threadgroup memory, mem_device for device buffers, or mem_none for an execution barrier only. See the Metal Shading Language Specification..
A barrier only waits for the threads of one threadgroup. There is no barrier between threadgroups inside a kernel. That is enough for tiling, because the threads that share a tile all belong to the same threadgroup.
Our kernel calls the barrier twice per phase, and each call protects a different dependence between threads.
- The barrier after section 2 protects a read-after-write dependence: no thread reads a tile before every thread has written its element into it.
- The barrier after section 3 protects a write-after-read dependence: no thread overwrites a tile with the next phase’s values before every thread has finished reading the current ones. Without it, a SIMD group that finishes section 3 early would start section 2 of the next phase while a slower SIMD group is still reading.
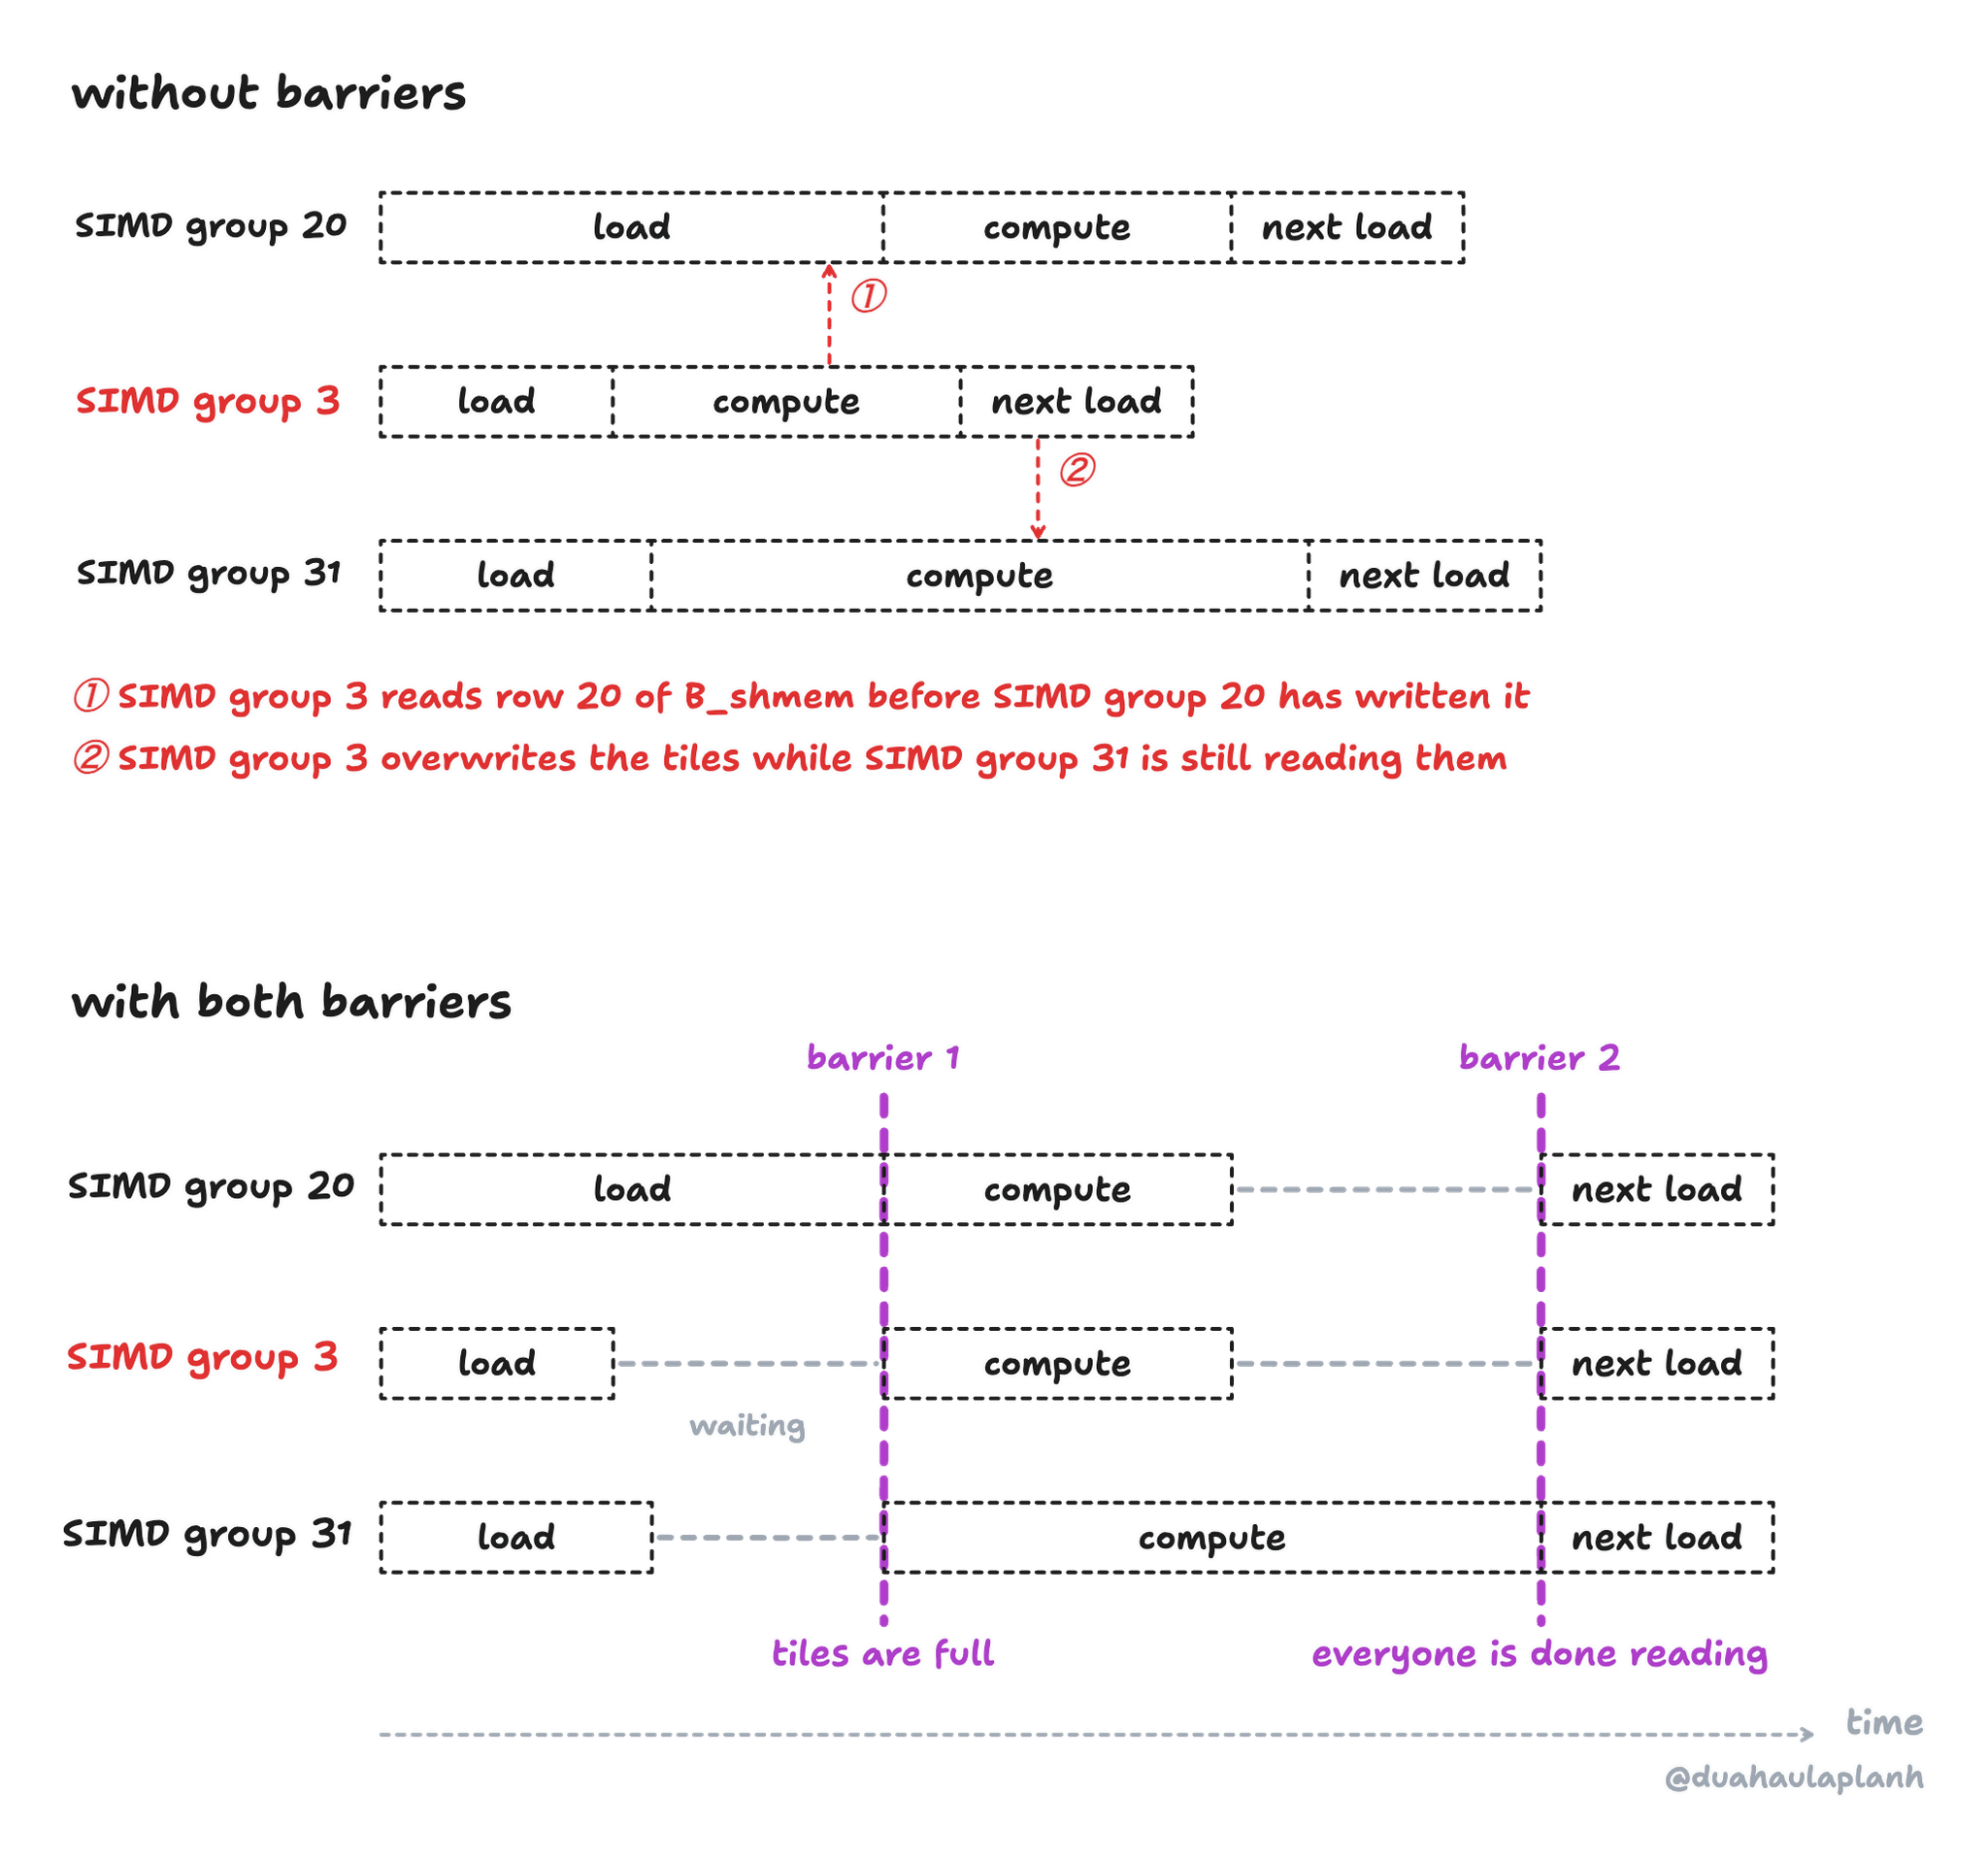
Three of the 32 SIMD groups in one threadgroup over one phase. Top: without barriers, SIMD group 3 (our thread’s) reads a row of B_shmem that SIMD group 20 hasn’t written yet ①, then starts overwriting the tiles while SIMD group 31 is still reading them ②. Bottom: barrier 1 holds every SIMD group until the tiles are full, and barrier 2 until everyone is done reading.
Example (Removing a barrier)
If we run the kernel at with one barrier removed, five runs each, and compare all M outputs against a CPU reference:
| Barrier removed | Wrong outputs, | Wrong outputs, |
|---|---|---|
| First (after loading) | 99.8% | 89-90% |
| Second (after computing) | 15-16% | 48% |
The result is wrong on every run for both ways, and the number of wrong outputs changes from run to run.
Results
| Kernel | GFLOP/s | vs naive |
|---|---|---|
| Naive | 365 | 1.00x |
Tiling 16x16 | 650 | 1.78x |
Tiling 32x32 | 666 | 1.82x |
Tiling actually works! Both tiled kernels are about 1.8x faster than the naive one. But our no-cache intensity estimate suggested that tiles could be nearly twice as fast as ones, since the larger tile halves the requested buffer bytes. In reality, they’re only 2.5% faster. What did we miss?
First, let’s see the profiler results:
| Counter | naive | tiled16 | tiled32 |
|---|---|---|---|
| GFLOP/s | 376 | 667 | 683 |
| GPU Read Bandwidth (GB/s) | 120.03 | 80.63 | 39.92 |
| Buffer L1 Read Bandwidth (GiB/s) | 788.22 | 155.38 | 79.59 |
| L1 Cache Limiter (%) | 6.81 | 8.06 | 10.31 |
| ThreadGroup L1 Read Accesses (%) | 0.00 | 69.14 | 89.13 |
| Instruction Throughput Limiter (%) | 61.30 | 80.97 | 80.59 |
| F32 Utilization (%) | 9.14 | 16.17 | 16.54 |
| Integer and Conditional Utilization (%) | 27.28 | 39.34 | 62.43 |
| Control Flow Limiter (%) | 19.09 | 32.94 | 17.76 |
The memory counters show what tiling bought us. The naive kernel reads about 120 GB/s from outside the GPU, right at our measured bandwidth ceiling. The tiled kernels run faster while reading only 81 and 40 GB/s. Loading each input once per threadgroup has relieved that demand on global memory. But the kernel uses half the bandwidth of the kernel and runs at almost the same speed, we need to know why?
First, let’s check our intensity estimates. The 4 and 8 FLOP/byte we calculated before assumed that every requested byte came from device memory. Even though tiling makes sharing within a threadgroup explicit, the caches can still share inputs between threadgroupsThreadgroups in the same row of the grid read the same rows of , and those in the same column read the same columns of . A value one threadgroup brought in may still be in the cache when its neighbour asks for it.. The profiler’s run takes about 206 ms, so its global memory reads is:
That is about half the 34.4 GB requested by the kernel. Using this traffic to estimate intensity gives us FLOP/byte. The same calculation for gives about 8.0 GB of reads and 17 FLOP/byte. Caching changed our estimate of the bytes moved, not what arithmetic intensity means.
At these intensities, the bandwidth roof allows roughly 1 and 2 TFLOP/s. The profiler measures only 667 and 683 GFLOP/s so both kernels sit below their roofs.
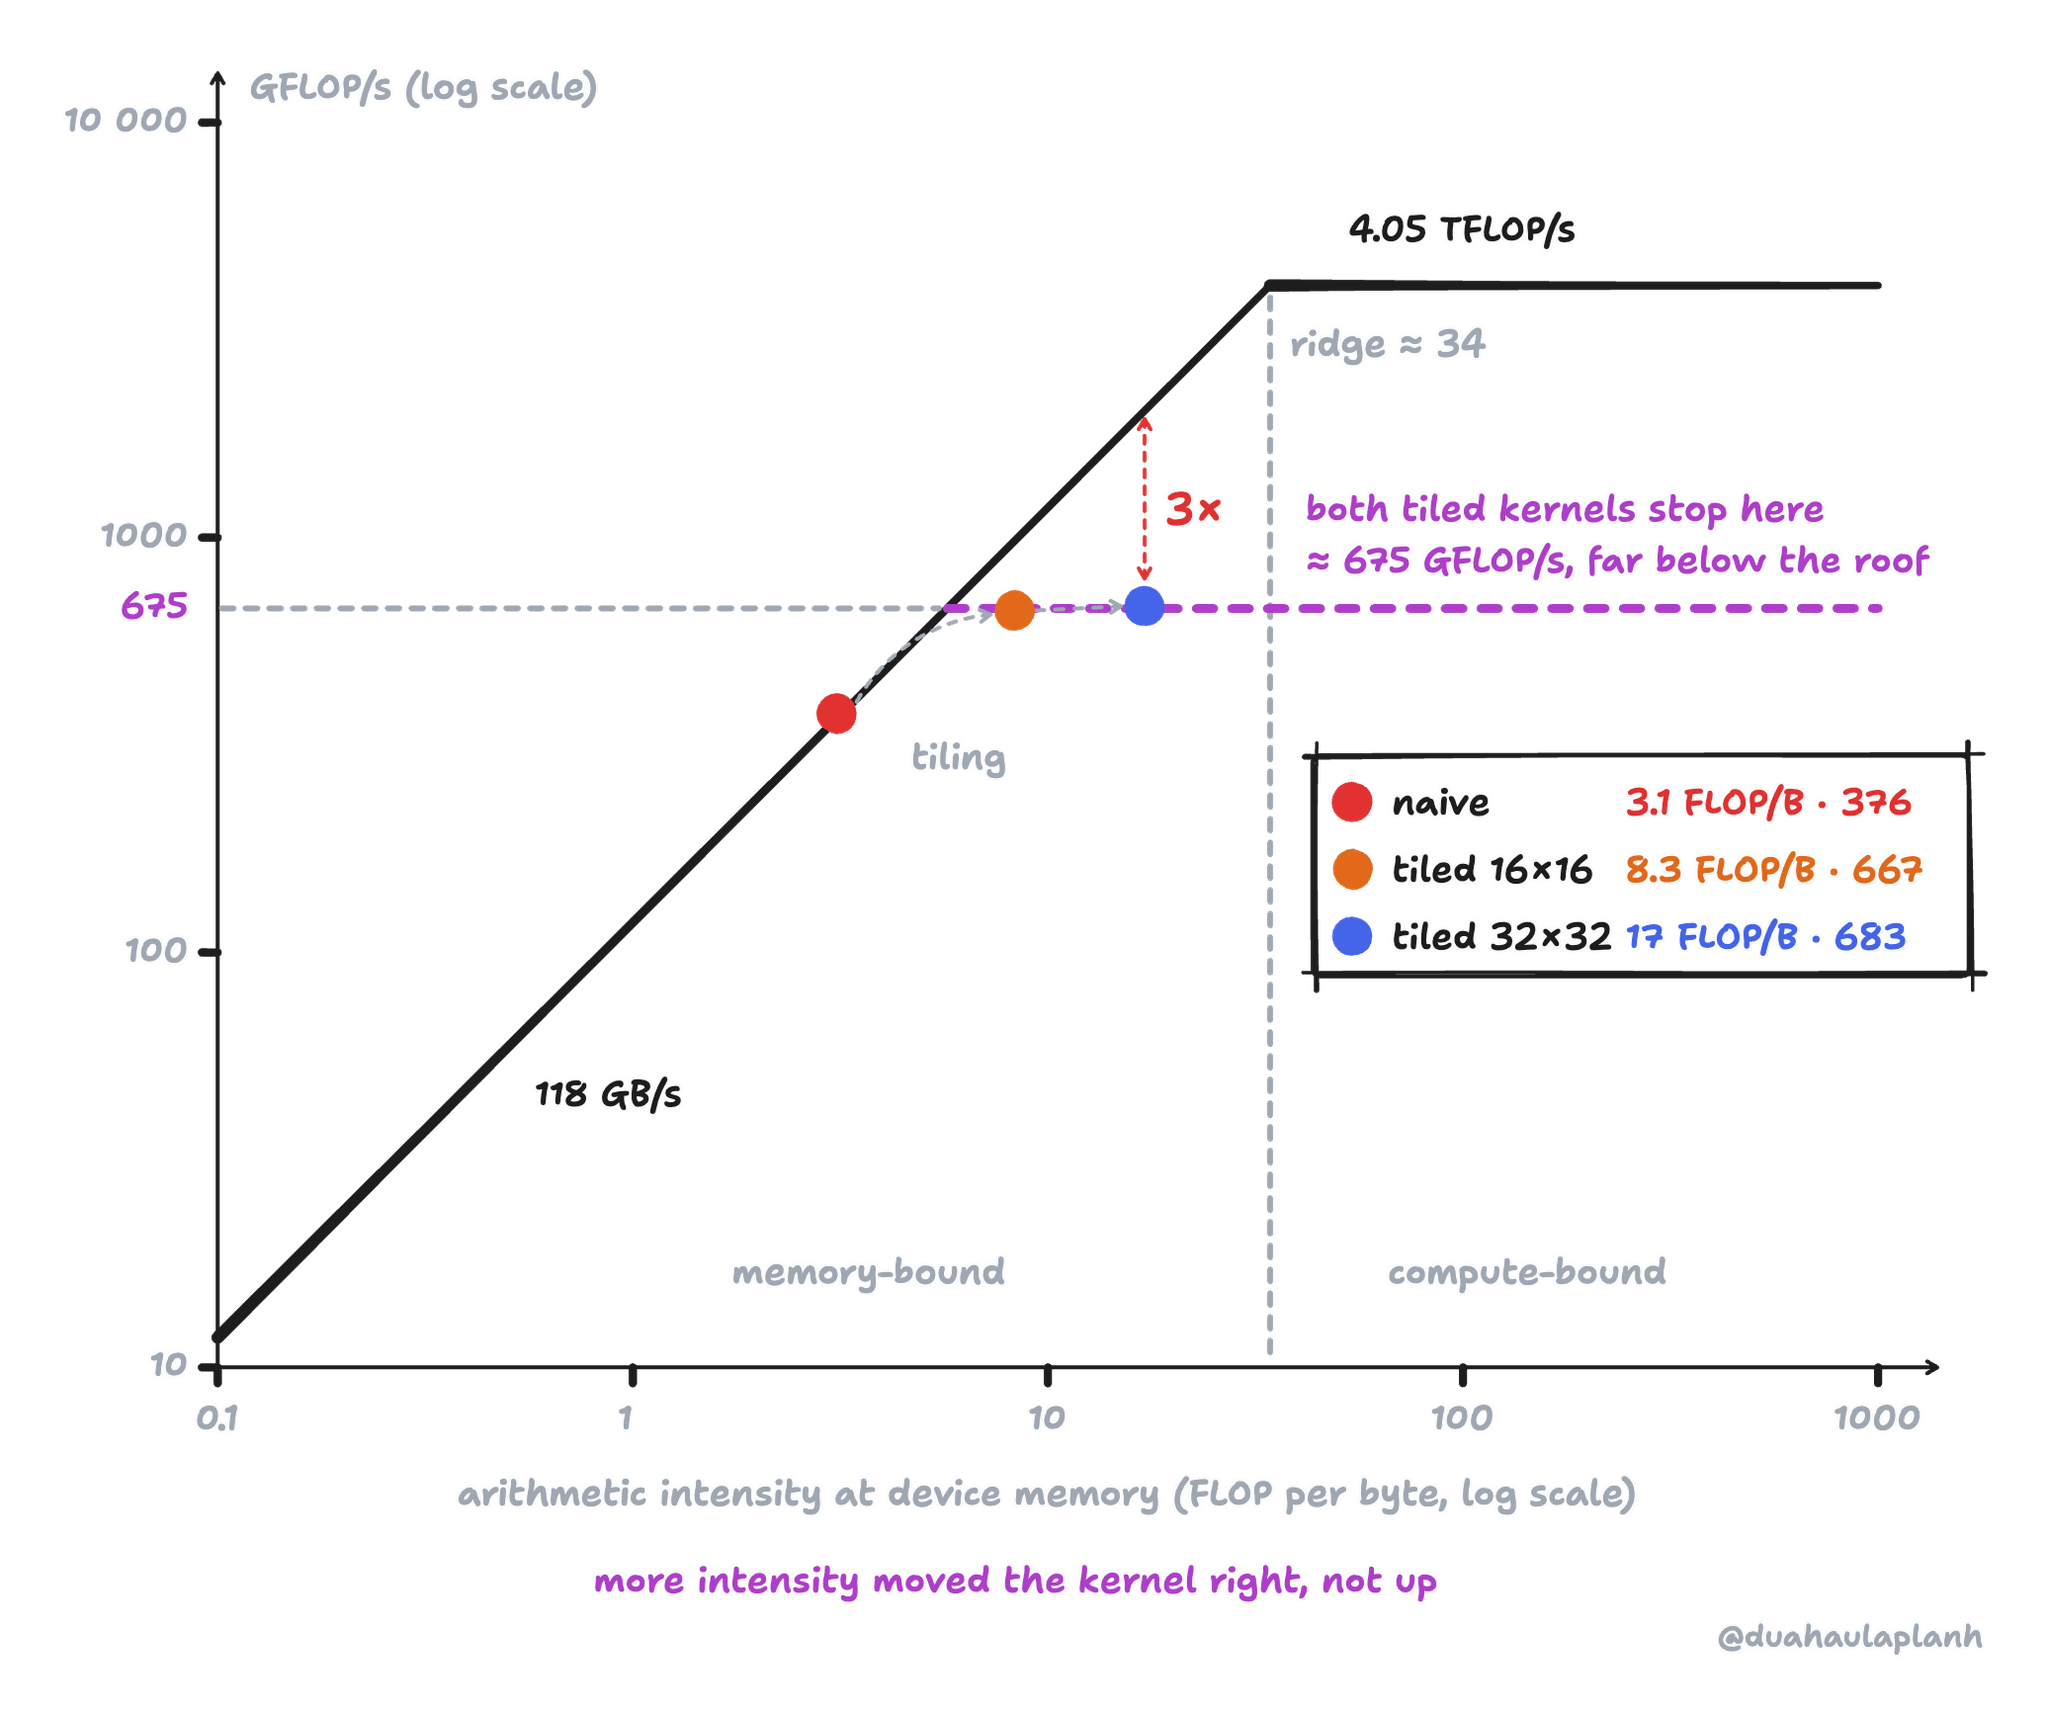
The naive and tiled kernels on the roofline, with intensity counted at device memory: 137.4 GFLOP divided by the bytes the profiler saw leave the GPU (GPU Read Bandwidth × GPU time). GFLOP/s are from the same profiler runs. The dashed line marks where both tiled kernels stop; it is measured, not derived. Same axes as the naive roofline in kernel 1.
Now, let’s go back to the inner loop:
C++
sum += A_shmem[tRow * BLOCK_N + k] * B_shmem[k * BLOCK_N + tCol];Each thread reads one value from A_shmem and one from B_shmem, then does one multiply-add. Tiling kernel moved those reads onto the core, but it didn’t remove them. With either tile size, every multiply-add still asks for two values from threadgroup memory, along with the address calculations and loop control. Even though a larger tile lets more threads share each buffer load, each of those threads still has to read the values from the shared tile.
Note (Evidence from profiler)
We can see that L1 Cache Limiter is only 8-10%, while Instruction Throughput Limiter is about 81% for both tile sizes. Meanwhile, the FP32 units do only about 16% of their peak work. This points toward instruction overhead and stalls around the arithmetic, rather than saturated external-memory or L1 bandwidth.
The roofline analysis in kernel 1 asked for reuse “from somewhere fast”. Threadgroup memory gave us that reuse between threads. Now we want reuse within a thread. If one thread computes several outputs that need the same input, it can load that input into a register once and use it in several multiply-adds, without another load for each use. That is the next kernel: thread coarsening.
Kernel 4: 1D Thread Coarsening
Take two outputs in the same column, and . At step , they need different values of , but the same value . In the tiled kernel, two threads load that value separately from threadgroup memory. What if one thread computed both outputs? It could load once into a register and use it in both multiply-adds. We would need three loads instead of four for the same arithmetic.
Thread coarsening
At each step , the thread loads once and reads different values of , one for each output. That gives threadgroup-memory loads for multiply-adds, or:
With , we have the tiled kernel’s two loads per multiply-add. Increasing spreads the one load of over more outputs. Since those outputs form a strip in one direction, we call this 1D coarsening.
![Two outputs in the same column, C[i, j] and C[i+1, j], at one step k. Left, the tiled kernel: thread 1 owns C[i, j] and thread 2 owns C[i+1, j]; each loads its own value of A from column k of A_shmem and both load B[k, j] from row k of B_shmem, so B[k, j] is loaded twice: 4 loads for 2 multiply-adds. Right, the coarsened kernel: one thread owns both outputs, loads B[k, j] once into the register Btmp, and computes sum[0] += A[i, k] · Btmp and sum[1] += A[i+1, k] · Btmp: 3 loads for 2 multiply-adds. With T_M outputs in one column, T_M + 1 loads for T_M multiply-adds; for T_M = 8, 9 loads for 8.](/_vercel/image?url=_astro%2Fcoarsening-idea-light.BmEVu0xZ.png&w=2048&q=100)
![Two outputs in the same column, C[i, j] and C[i+1, j], at one step k. Left, the tiled kernel: thread 1 owns C[i, j] and thread 2 owns C[i+1, j]; each loads its own value of A from column k of A_shmem and both load B[k, j] from row k of B_shmem, so B[k, j] is loaded twice: 4 loads for 2 multiply-adds. Right, the coarsened kernel: one thread owns both outputs, loads B[k, j] once into the register Btmp, and computes sum[0] += A[i, k] · Btmp and sum[1] += A[i+1, k] · Btmp: 3 loads for 2 multiply-adds. With T_M outputs in one column, T_M + 1 loads for T_M multiply-adds; for T_M = 8, 9 loads for 8.](/_vercel/image?url=_astro%2Fcoarsening-idea-dark.BXEcFegJ.png&w=2048&q=100)
Two outputs in the same column at one step . Left: the tiled kernel gives them to two threads, and both load from threadgroup memory. Right: one thread computes both, keeps in a register, and saves a load. With outputs per thread, it takes loads for multiply-adds.
Implementation
Note
Following
That’s why we set BM = BN = 64, BK = 8, and TM = 8. We launch 512 threads per threadgroup and threadgroups. As in kernels 2 and 3, I dropped the bounds checks here, try to do it yourself, have fun!
C++matmul_1D_coarsening
template <uint BM, uint BN, uint BK, uint TM>kernel void matmul_1D_coarsening(device const float* A [[buffer(0)]], device const float* B [[buffer(1)]], device float* C [[buffer(2)]], uint M, uint N, uint K, uint2 block_pos [[ threadgroup_position_in_grid ]], uint2 thread_pos [[ thread_position_in_threadgroup ]]){ uint bRow = block_pos.y; uint bCol = block_pos.x; uint tid = thread_pos.x; // 1D threadgroup: tid = 0, ..., BM * BN / TM - 1
// this thread owns rows tRow * TM, ..., tRow * TM + TM - 1 of column tCol uint tRow = tid / BN; uint tCol = tid % BN;
// and copies one element of each tile uint tileRowA = tid / BK, tileColA = tid % BK; uint tileRowB = tid / BN, tileColB = tid % BN;
// 1. allocate threadgroup memory and move the pointers threadgroup float A_shmem[BM * BK]; threadgroup float B_shmem[BK * BN];
A += bRow * BM * K; B += bCol * BN; C += bRow * BM * N + bCol * BN;
float sum[TM] = {0.f}; // TM results, kept in registers for (uint ph = 0; ph < K; ph += BK) { // 2. collaboratively load one tile of A and one tile of B A_shmem[tileRowA * BK + tileColA] = A[tileRowA * K + tileColA]; B_shmem[tileRowB * BN + tileColB] = B[tileRowB * N + tileColB]; threadgroup_barrier(mem_flags::mem_threadgroup);
// 3. compute TM results from the tiles for (uint k = 0; k < BK; ++k) { float Btmp = B_shmem[k * BN + tCol]; // one load, reused TM times for (uint i = 0; i < TM; ++i) { sum[i] += A_shmem[(tRow * TM + i) * BK + k] * Btmp; } } threadgroup_barrier(mem_flags::mem_threadgroup);
// 4. slide both tiles along K A += BK; B += BK * N; }
// 5. write the TM results for (uint i = 0; i < TM; ++i) { C[(tRow * TM + i) * N + tCol] = sum[i]; }}Let’s keep following . It lies in threadgroup , at row 35 and column 29 of that group’s output tile. Row 35 falls in the band covering rows 32 through 39, so tRow = 4 and tCol = 29. Its owner is thread . That thread computes through ; our is its fourth output, accumulated in sum[3].
![One phase of the 1D-coarsened kernel for threadgroup (1, 0). A_shmem is a 64 by 8 tile and B_shmem an 8 by 64 tile; their product updates a 64 by 64 tile of C. The C tile is split into 8 bands of 8 rows, one band per thread row tRow = 0 to 7, and 64 columns, one per tCol. Thread 285 has tRow = 4 and tCol = 29, so it owns the 8 by 1 strip at rows 32 to 39, column 29 of the tile: C[32 … 39, 93]. It reads rows 32 to 39 of A_shmem and column 29 of B_shmem. 512 threads, 8 outputs each.](/_vercel/image?url=_astro%2Fcoarsening-tiles-light.CIzaMCMH.png&w=2048&q=100)
![One phase of the 1D-coarsened kernel for threadgroup (1, 0). A_shmem is a 64 by 8 tile and B_shmem an 8 by 64 tile; their product updates a 64 by 64 tile of C. The C tile is split into 8 bands of 8 rows, one band per thread row tRow = 0 to 7, and 64 columns, one per tCol. Thread 285 has tRow = 4 and tCol = 29, so it owns the 8 by 1 strip at rows 32 to 39, column 29 of the tile: C[32 … 39, 93]. It reads rows 32 to 39 of A_shmem and column 29 of B_shmem. 512 threads, 8 outputs each.](/_vercel/image?url=_astro%2Fcoarsening-tiles-dark.C1SIQRpE.png&w=2048&q=100)
One phase of the 1D kernel for threadgroup . Thread 285 owns an strip of the tile, to , and reads the matching 8 rows of A_shmem and one column of B_shmem. Not to scale: the dimension of the tiles is drawn wider than it is. Layout adapted from
Before thread 285 can touch any of those values, the 512 threads have to fill the two tiles together, just like in kernels 2 and 3. Each thread copies one element of each tile per phase, so you can read the tile shapes straight from the thread count:
![Section 2 of the 1D kernel for one phase. The A tile is 64 rows by 8 columns: thread tid copies row tid / 8, column tid % 8, so row 0 comes from threads 0 to 7, row 35 from threads 280 to 287, and row 63 from threads 504 to 511. The B tile is 8 rows by 64 columns: thread tid copies row tid / 64, column tid % 64, so row 0 comes from threads 0 to 63 and row 4 from threads 256 to 319. SIMD group 8, threads 256 to 287, copies rows 32 to 35 of the A tile and the first half of row 4 of the B tile. Thread 285 copies A_shmem[35, 5] and B_shmem[4, 29]. 512 threads with one element of each tile means the 64-row A tile has 512 / 64 = 8 columns, so BK = 8.](/_vercel/image?url=_astro%2Fcoarsening-load-light.DOHlnZEO.png&w=2048&q=100)
![Section 2 of the 1D kernel for one phase. The A tile is 64 rows by 8 columns: thread tid copies row tid / 8, column tid % 8, so row 0 comes from threads 0 to 7, row 35 from threads 280 to 287, and row 63 from threads 504 to 511. The B tile is 8 rows by 64 columns: thread tid copies row tid / 64, column tid % 64, so row 0 comes from threads 0 to 63 and row 4 from threads 256 to 319. SIMD group 8, threads 256 to 287, copies rows 32 to 35 of the A tile and the first half of row 4 of the B tile. Thread 285 copies A_shmem[35, 5] and B_shmem[4, 29]. 512 threads with one element of each tile means the 64-row A tile has 512 / 64 = 8 columns, so BK = 8.](/_vercel/image?url=_astro%2Fcoarsening-load-dark.JklT453c.png&w=2048&q=100)
Section 2 of the kernel, for one phase: each of the 512 threads copies one element of each tile. Since the tile has 64 rows, one element per thread gives it columns, and that is where BK = 8 comes from. Blue: SIMD group 8, which holds our thread 285; red: the two elements thread 285 copies. Not to scale. Layout adapted from
Once the barrier says both tiles are full, thread 285 only looks at its own eight rows of A_shmem and its own column of B_shmem. Now we can count what one phase costs it:
Important (Counting the loads)
At each step , our thread reads eight values of and one of from threadgroup memory, then does eight multiply-adds. That is nine loads for eight multiply-adds, instead of the 16 loads eight threads would request in the tiled kernel. Across the eight steps of one phase, the thread requests 72 loads and does 64 multiply-adds. The ratio is still loads per multiply-add.
Counting the bytes requested by these reads gives a threadgroup-memory intensity of:
up from the tiled kernel’s . This count tells us how much arithmetic we get for the bytes requested by the reads in our code.
The larger output tile also reduces buffer loads. In one phase, the threadgroup copies floats (4 KiB) and does multiply-adds. At device memory, assuming every requested byte reaches it, the intensity is:
twice the tiled kernel’s no-cache estimate of 8. Across the grid, the kernel requests GB from the device buffers. Caches can reduce that traffic further, as they did for kernels 2 and 3.
Keeping in a register gives us fewer loads to issue and fewer addresses to calculate for the same arithmetic. That is the overhead the tiled kernels’ profiles pointed us toward. We now need eight accumulators per thread, though, and the smaller BK means more phases and barriers. The load count gives us a reason to try this kernel; the benchmark will tell us whether the changes pay off.
Here is that reuse at work in two steps of thread 285’s inner loop. At each step, one load of B goes into a register and feeds all eight multiply-adds.
![Section 3 of the 1D kernel for thread 285, at k = 0 and k = 1. At each step, the thread loads one element of B_shmem, row k and column 29, into the register Btmp, then reads the 8 elements of column k of A_shmem in rows 32 to 39. Each of them times Btmp is added to one of the 8 accumulators sum[0] to sum[7], which hold C[32, 93] to C[39, 93]. Per step: 1 load of B plus 8 loads of A, 9 loads for 8 multiply-adds. In the tiled kernel, 2 loads for 1 multiply-add.](/_vercel/image?url=_astro%2Fcoarsening-inner-loop-light.BSVsWU2P.png&w=2048&q=100)
![Section 3 of the 1D kernel for thread 285, at k = 0 and k = 1. At each step, the thread loads one element of B_shmem, row k and column 29, into the register Btmp, then reads the 8 elements of column k of A_shmem in rows 32 to 39. Each of them times Btmp is added to one of the 8 accumulators sum[0] to sum[7], which hold C[32, 93] to C[39, 93]. Per step: 1 load of B plus 8 loads of A, 9 loads for 8 multiply-adds. In the tiled kernel, 2 loads for 1 multiply-add.](/_vercel/image?url=_astro%2Fcoarsening-inner-loop-dark.D9Q4IHZ_.png&w=2048&q=100)
Section 3 of the kernel for thread 285 at and : one load of B_shmem into Btmp, eight loads down column of A_shmem, eight multiply-adds into sum. sum[3] accumulates our old . After the 8 steps of a phase, each sum[i] has gained 8 terms. Layout adapted from
Results
| Kernel | GFLOP/s | vs tiling 32x32 |
|---|---|---|
Tiling 32x32 | 666 | 1.00x |
| 1D coarsening | 1222 | 1.83x |
The 1D kernel reaches 1222 GFLOP/s, 1.83x the tiled kernel’s rate. Giving each thread eight outputs has paid off: we now reach 30% of the FP32 ceiling and 36% of MPS. Let’s check what changed inside the GPU:
| Counter | tiled32 | 1D |
|---|---|---|
| GFLOP/s | 683 | 1230 |
| Instruction Throughput Limiter (%) | 80.59 | 77.96 |
| F32 Utilization (%) | 16.54 | 30.20 |
| Integer and Conditional Utilization (%) | 62.43 | 35.40 |
| Threadgroup Memory L1 Read Bandwidth (GiB/s) | 1312.25 | 435.02 |
| GPU Read Bandwidth (GB/s) | 39.92 | 45.67 |
| Register spills | none | none |
The FP32 units do about 30% of their peak work, up from 16.5%, matching the increase in throughput. At the same time, integer and conditional utilization falls from 62% to 35%, and threadgroup-memory read bandwidth falls from 1312 to 435 GiB/s. The kernel is doing the same arithmetic faster while putting less demand on those parts of the GPU. That supports the reason why we tried coarsening: less work around each multiply-addThe nine loads per step are a count of read requests in the source code. The L1 bandwidth counter measures hardware traffic, which need not equal four bytes for every such request. Also, this comparison includes the larger output tile, the smaller BK, and the new thread mapping; it does not isolate the effect of reusing in a register..
The external read bandwidth actually rises, from about 40 to 46 GB/s. Did we make device-memory traffic worse? Remember that bandwidth is a rate. The profiled kernel finishes in about 112 ms instead of 201 ms, so its total external reads fall from 8.0 GB to:
As in kernels 2 and 3, we use those external reads to estimate device-memory traffic. The intensity is then FLOP/byte, above our no-cache estimate of 16. Its bandwidth roof is about TFLOP/s, while the profiler measures 1.23 TFLOP/s. We have raised the intensity and the performance, but there is still a large gap below the roof.
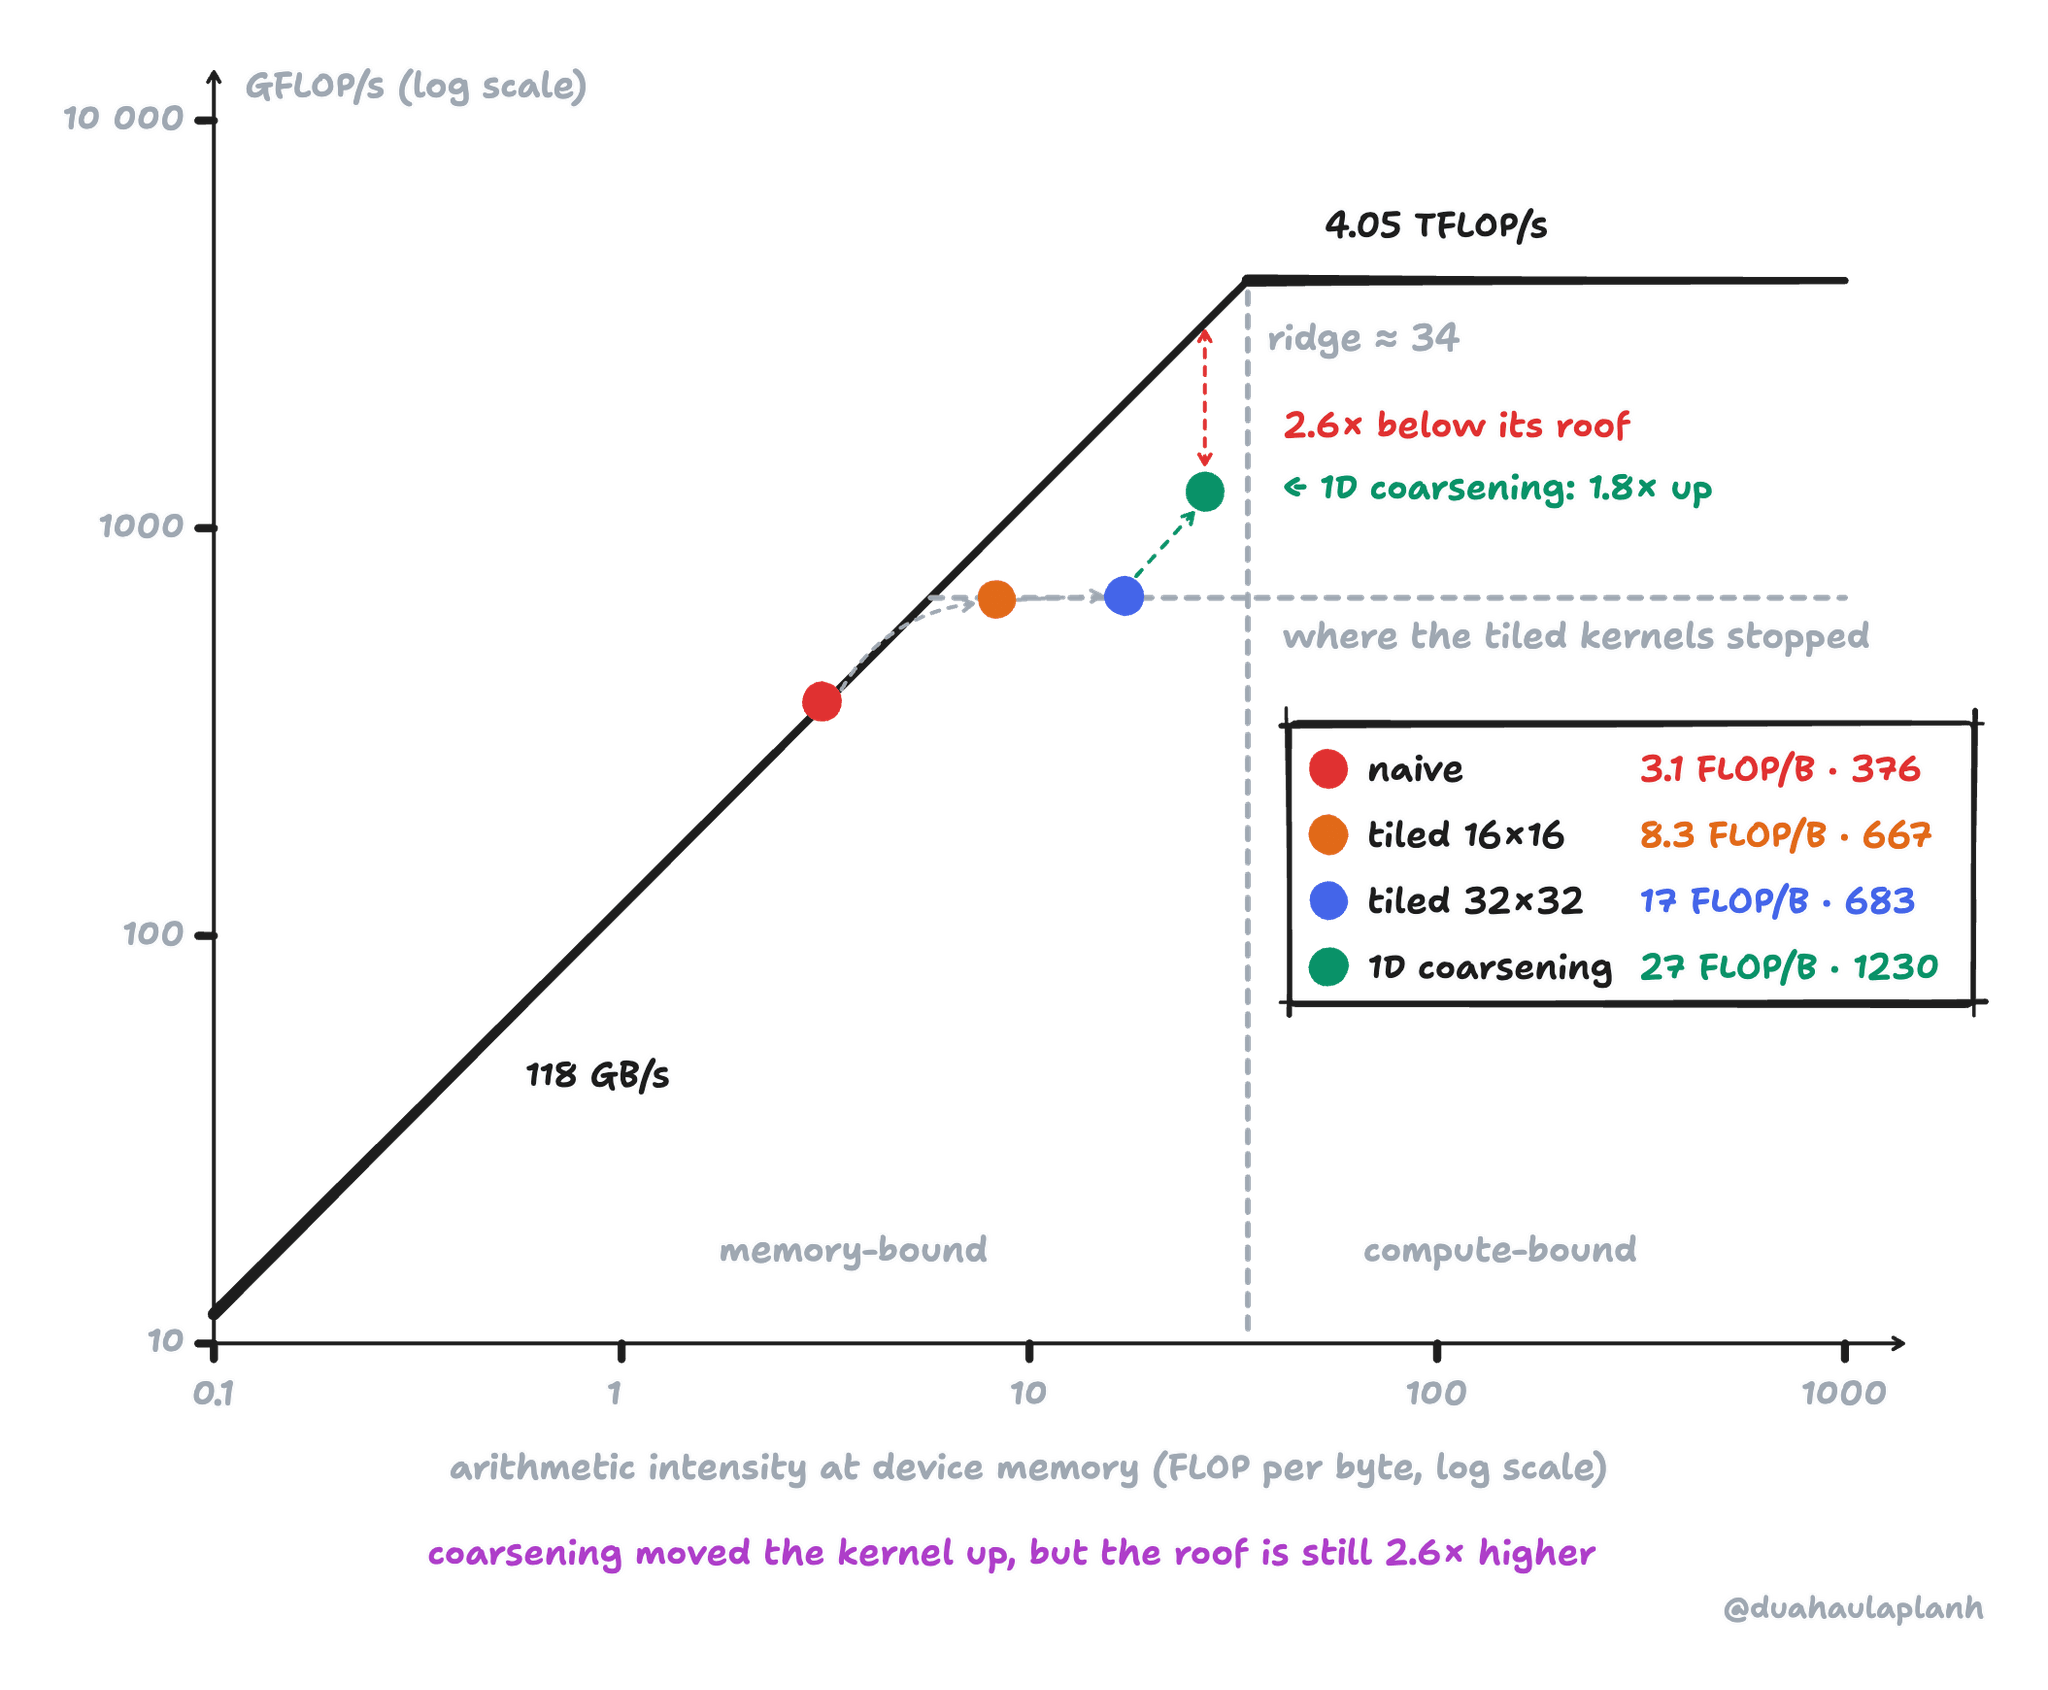
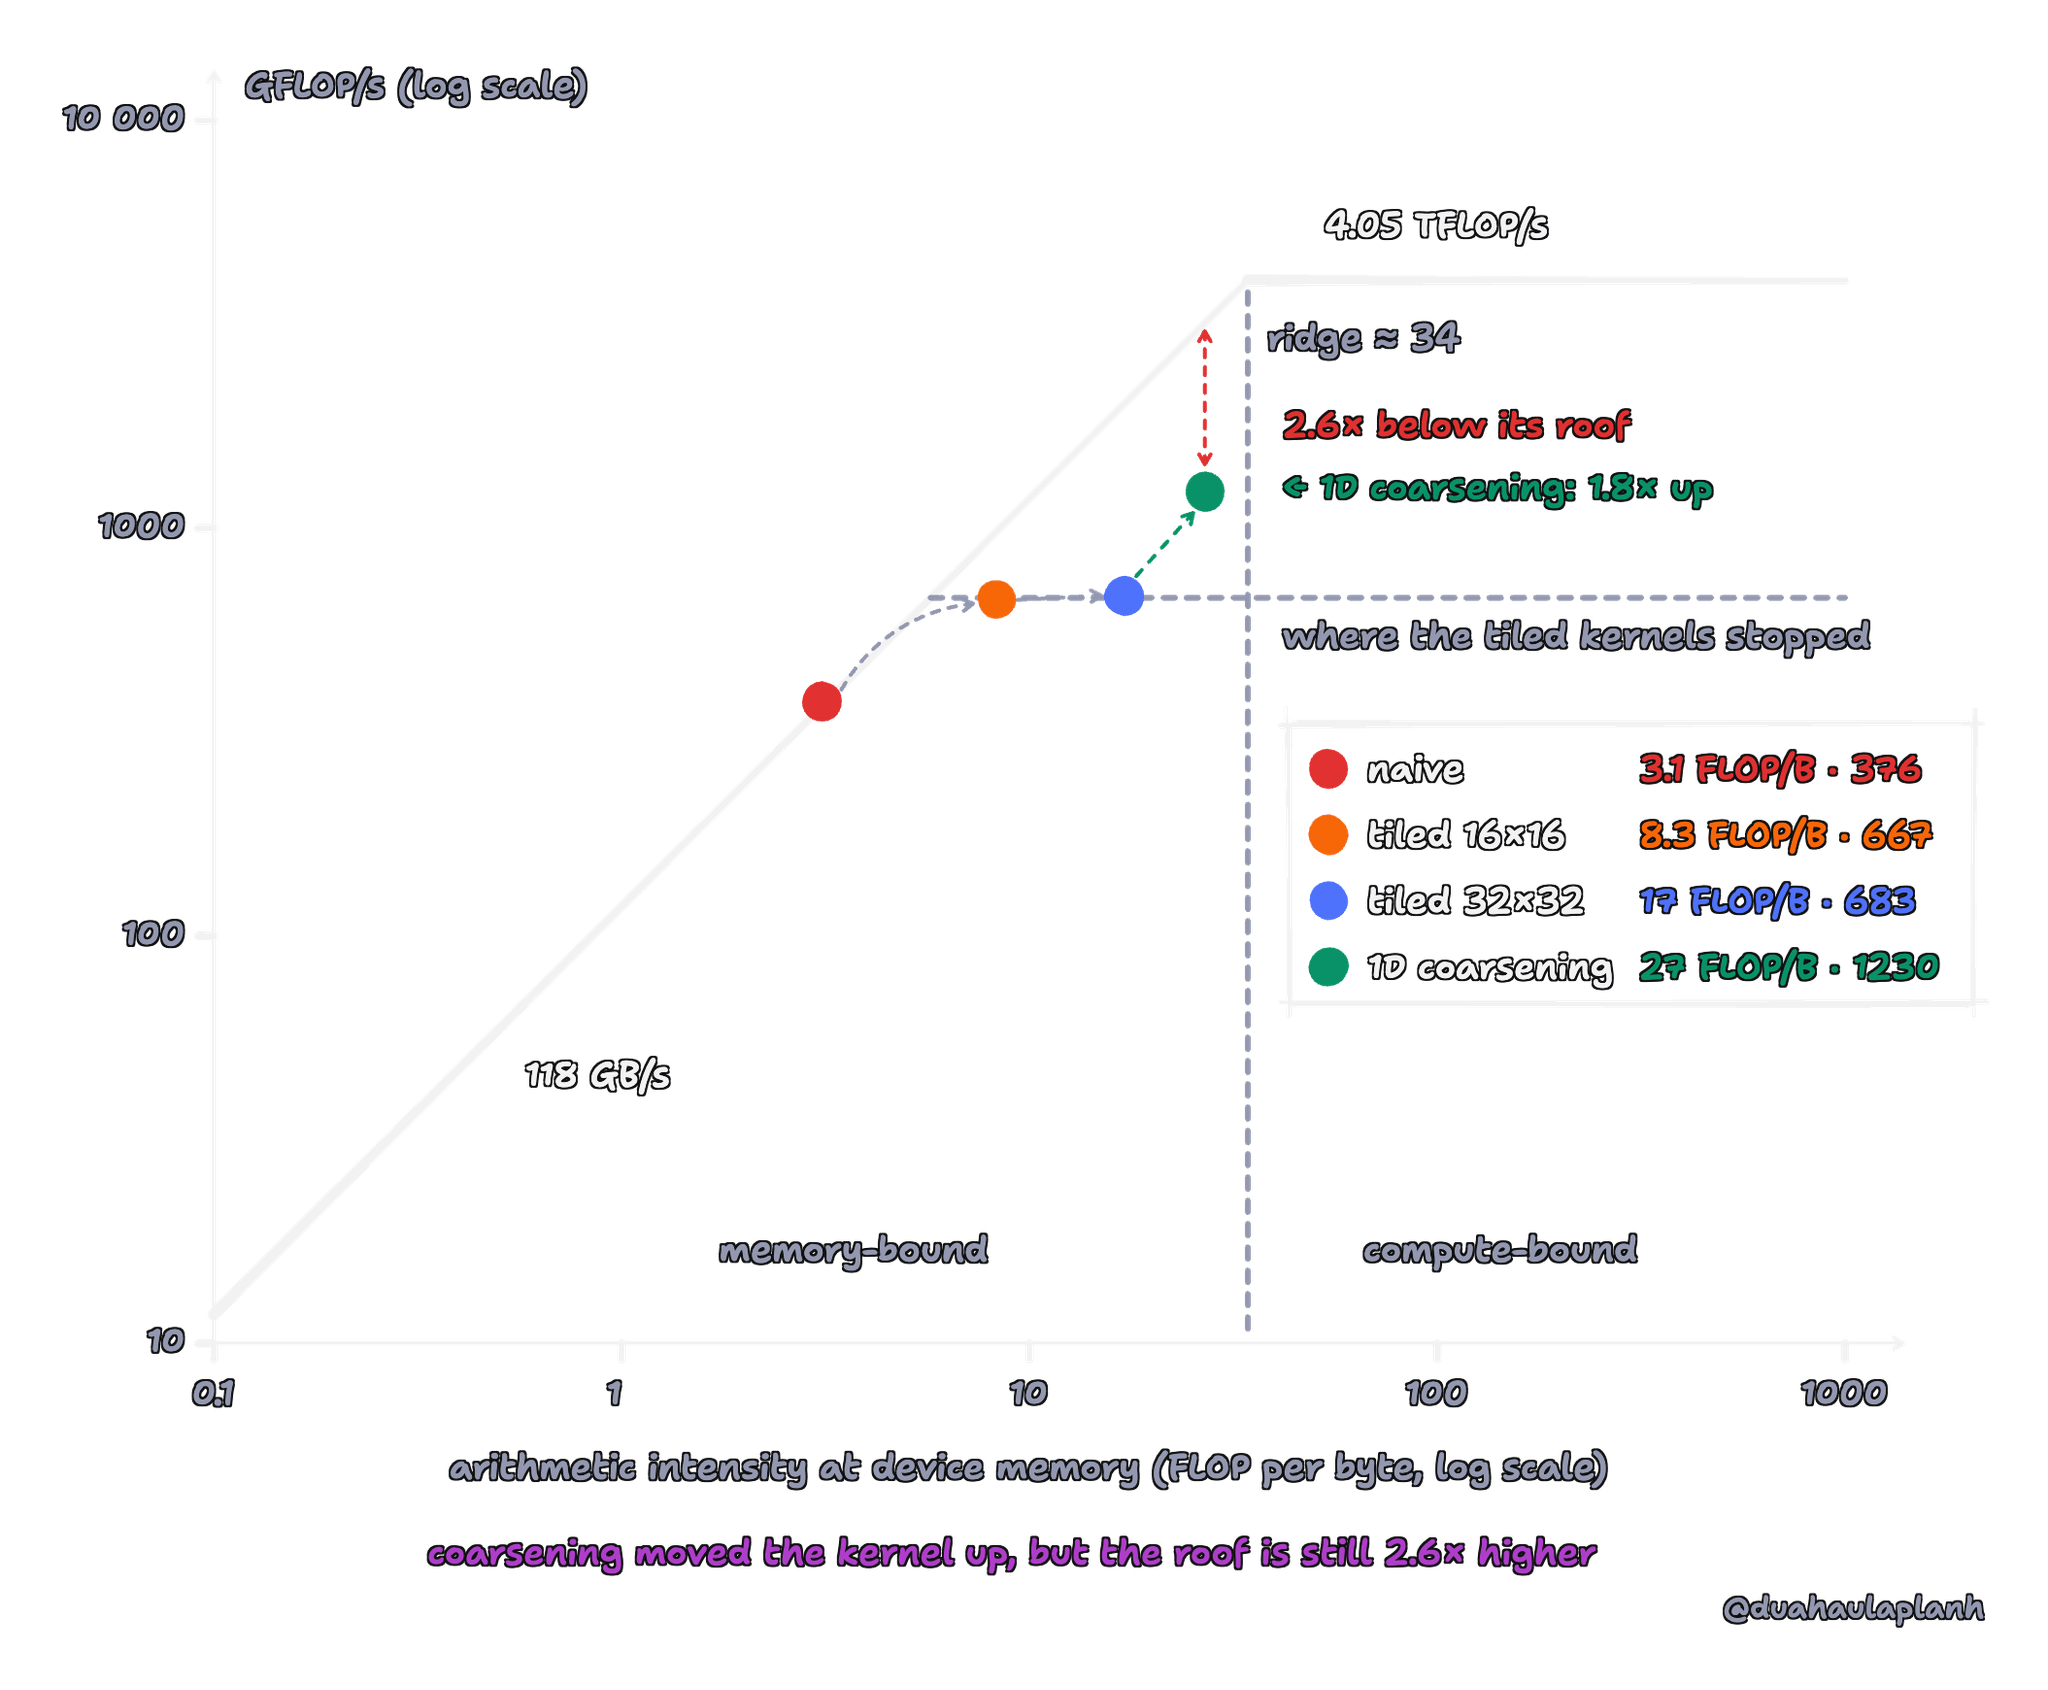
The 1D kernel on the roofline, with the earlier kernels for comparison. As before, intensity is 137.4 GFLOP divided by the bytes the profiler saw leave the GPU, and GFLOP/s are from the same profiler runs. This time the kernel moves up as well as right, but its roof at 27 FLOP/byte is still 2.6× higher than where it runs.
Instruction Throughput Limiter remains high at 78%. It includes both work and stalls, so it does not identify a precise issue-rate limit. The counter still points us toward instruction work and stalls, and the inner loop still has an input it doesn’t reuse within the thread: every multiply-add reads a different value of .
Our count shows the limit of this particular reuse. Increasing spreads the load of more thinly, but the one load of per multiply-add remains. A thread could reuse both inputs by computing a rectangle of outputs instead and that would be 2D coarsening but we will stop coarsening hereLet’s have some fun to try 2D coarsening yourself, 2D coarsening is really interesting! Remember to read
Our next kernels will move to modern Metal features: simdgroup_matrix, it let the 32 threads of a SIMD group hold tiles together and multiply them with one call.
Next
Kernel 4 reaches 1222 GFLOP/s, 36% of MPS, and every multiply-add is still a separate scalar instruction. Part 2 will continue with kernels 5 to 9: SIMD-group matrices, sharing inputs through threadgroup memory, and TensorOps, ending ahead of MPS.
References
- [1]How to Optimize a CUDA Matmul Kernel for cuBLAS-like Performance: a Worklog[HTML]Simon Boehm, 2022. Blog post.
- [2]Outperforming cuBLAS on H100: a Worklog[HTML]Pranjal Shankhdhar, 2024. CUDA for Fun.
- [3]Worklog: optimising GEMM on NVIDIA H100 for cuBLAS-like performance[HTML]Hamza Elshafie, 2025. Blog post.
- [4]Fast Matrix Multiply on an Apple GPU[HTML]Zeke Medley, 2025. Percisely.
- [5]Apple unleashes M5, the next big leap in AI performance for Apple silicon[HTML]Apple Inc., 2025. Apple Newsroom.
- [6]metal-benchmarks: Apple GPU microarchitecture[HTML]Philip Turner, 2022. GitHub repository.
- [7]Accelerate your machine learning workloads with the M5 and A19 GPUs[HTML]Apple Inc., 2026. Apple Developer Tech Talks.
- [8]Roofline: An Insightful Visual Performance Model for Multicore Architectures[DOI]Samuel Williams, Andrew Waterman, and David Patterson, 2009. Communications of the ACM, vol. 52, pp. 65--76
- [9]How to Scale Your Model[HTML]Jacob Austin, Sholto Douglas, Roy Frostig, et al., 2025. Google DeepMind.
- [10]Explore GPU advancements in M3 and A17 Pro[HTML]Apple Inc., 2023. Apple Developer Tech Talks.
- [11]Programming Massively Parallel Processors: A Hands-on ApproachDavid B. Kirk and Wen-mei W. Hwu, 2022. Morgan Kaufmann.